
 Economic Impact Map
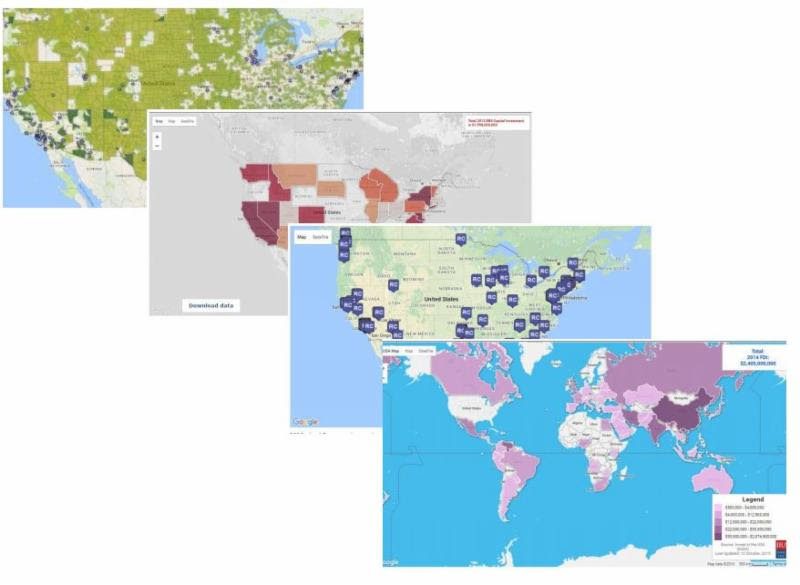
The EB-5 Economic Impact Map (below) demonstrates economic impact generated by EB-5 investments at the state and Congressional district levels from FY2010 to FY2013…Read More
Investor Origin Map
The EB-5 Investor Markets Map demonstrates trends and origins of America’s new job creators investing in the U.S. via the EB-5 Program…Read More
Regional Center Members Map
The IIUSA Regional Center Members Map plots the location of all IIUSA regional center members throughout the country. The interactive map enables users to sort regional center by geography, approval year and I-526/829 approvals…Explore Here
TEA Policy Mapping Tool
IIUSA’s newest interactive mapping tool plots the location of over 480 EB-5 projects from a wide variety of industries and located in diverse communities across the U.S. The map is an essential instrument for industry and policy analysis. The interactive map is a tool for consideration of a specific proposal to reform Targeted Employment Area (TEA) policy…Download Here