New I-526 Data by Country Illuminates EB-5 Investor Demand Trends
By Suzanne Lazicki, Lucid Professional Writing, Charts by Lee Li, Policy Analyst, IIUSA
Where in the world can EB-5 investors be found? We can now answer this question with some precision thanks to a new report from the USCIS, which sorts I-526 petition approvals by the investor’s country of birth for each fiscal year from 1992 to 2012. IIUSA obtained the report from the USCIS Office of Performance and Quality via an- other successful FOIA (Freedom of Information Act) request, adding to the collection of industry intelligence available to members through the IIUSA “All-Access Pass.” I-526 petition numbers correspond directly to the number of investors, making the data a more precise measurement of demand than State Department EB-5 visa numbers, which reflect investors as well as their family members.
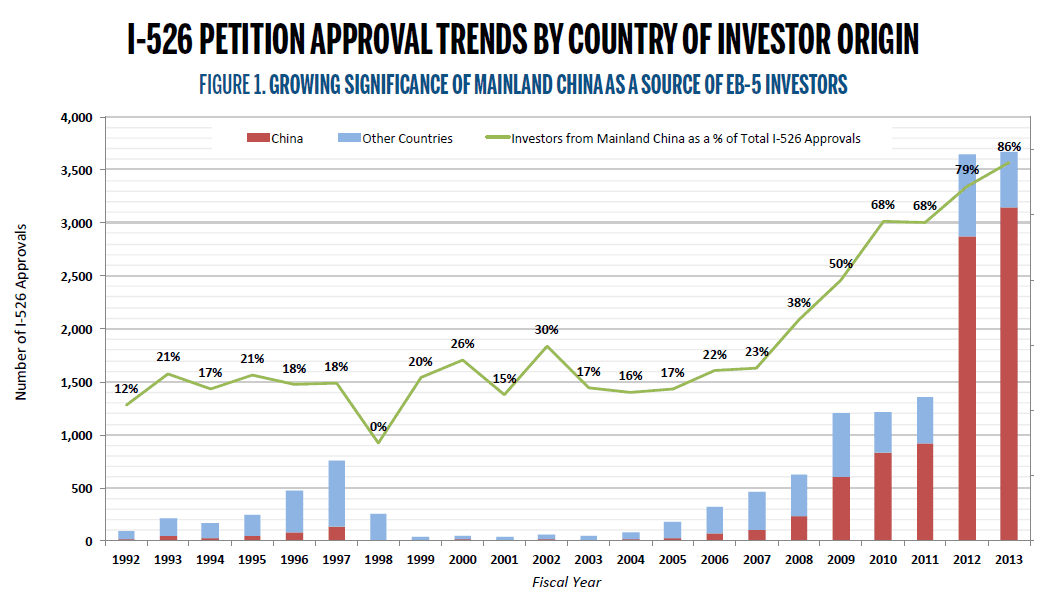
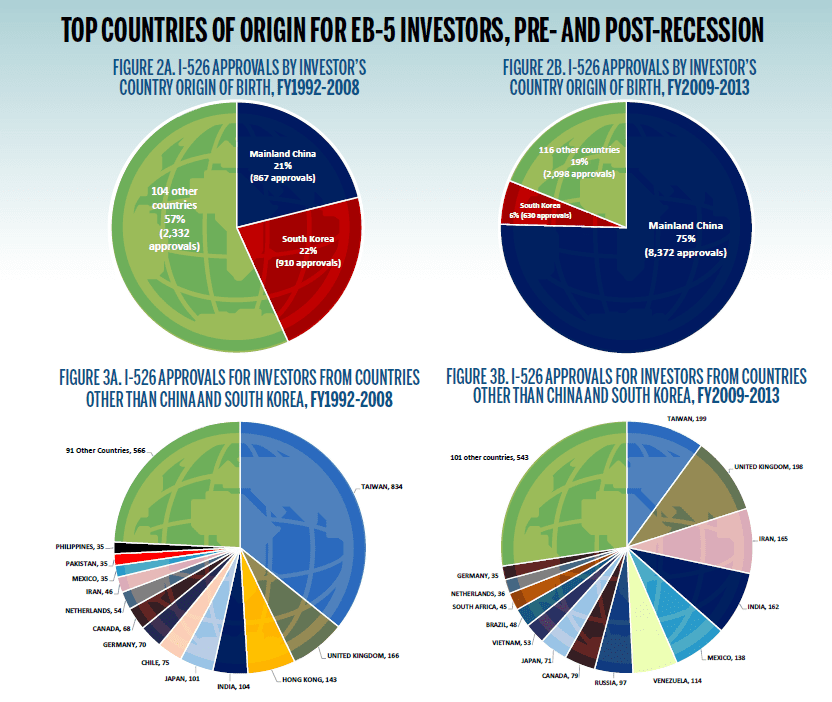
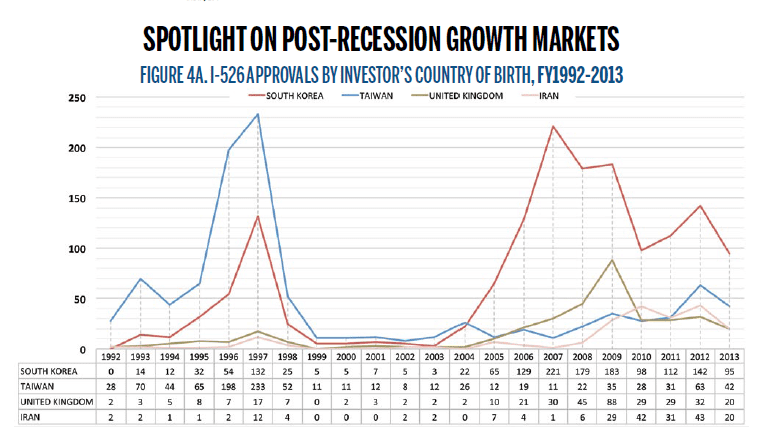
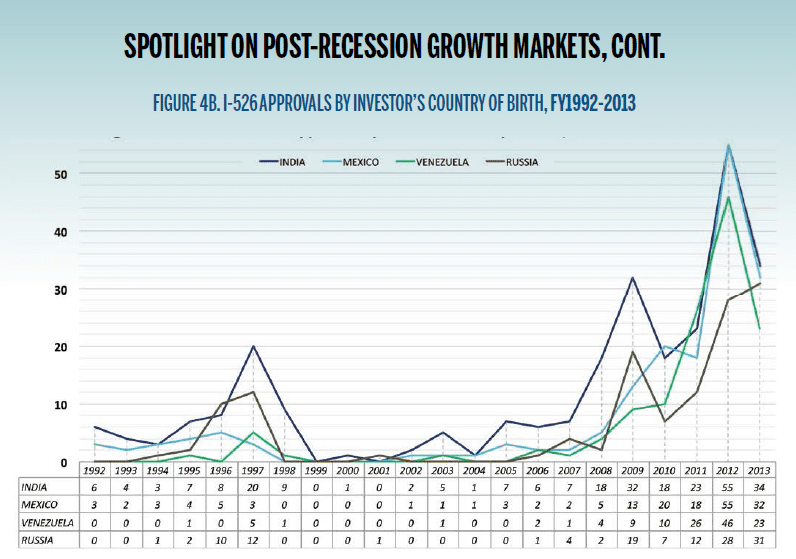
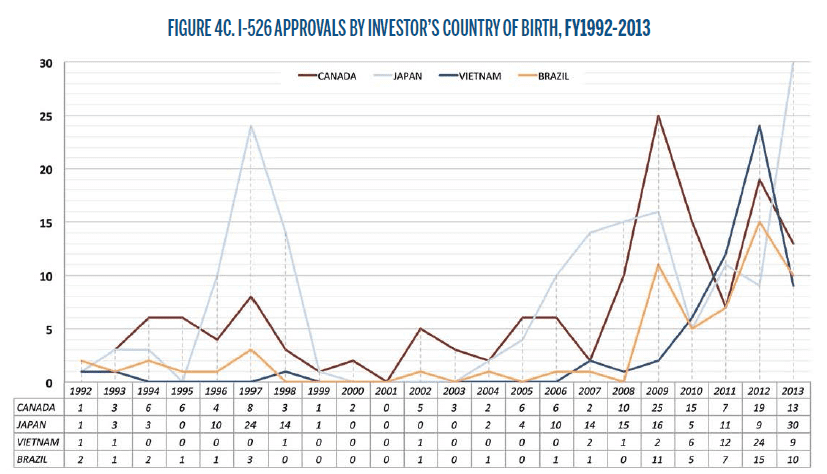
Examining the number of I-526 petition approvals by year and the investor’s country of origin reveals consolidation, diversification, and demand shifts in the EB-5 market. The numbers confirm that mainland China has grown dramatically both in terms of number of investors and market share. While China accounted for only a quarter of all EB-5 investors in the pre-Recession period, it has accounted for three quarters of all EB-5 investors since then. South Korea has remained the second largest source of EB-5 investors overall but with a diminishing market share: 22% of EB-5 investors before 2009 and 6% of investors since. Taiwan and the United Kingdom have ranked in third and fourth place overall, but with the UK gaining in relative significance. The roster of countries supplying the balance of EB-5 investors has changed over time. In the pre-Recession period, Hong Kong, India, Japan, Chile, and Germany ranked just below the UK by number of investors. Of these, only India has held its ranking since 2009. Countries growing in significance in recent years include Iran, Mexico, Venezuela, Russia, Vietnam, Brazil, and South Africa. Meanwhile, India, Canada, Japan, Netherlands, and Germany have continued to supply a moderate number EB-5 investors. While mainland China has been an increasingly dominant source of EB-5 investors, the total number of countries contributing investors has also grown. I-526 approvals since 2009 represent EB-5 investors from a total of 118 countries, while 106 countries were represented prior to 2009. Demand trends for countries other than China become especially significant as EB-5 visa numbers approach the annual quota, raising the possibility of quota backlogs for Chinese investors.
The following charts illustrate some of the demand trends that can be tracked using I-526 petition approval numbers by country and year. The complete report, available from IIUSA through the All Access Pass, includes raw data from fiscal year 1992 through May 14, 2013, the report query date. ■
RCBJ Retrospective articles are reprinted from IIUSA’s Regional Center Business Journal trade magazine. Opinions expressed within these articles do not necessarily represent the views of IIUSA and are provided for educational purposes.

