Research EB-5 targeted employment areas (TEA)
across the U.S. with this new interactive and free tool
IIUSA is excited to launch this new mapping tool that allows EB-5 stakeholders to check TEA qualification for every single census tract in the U.S.
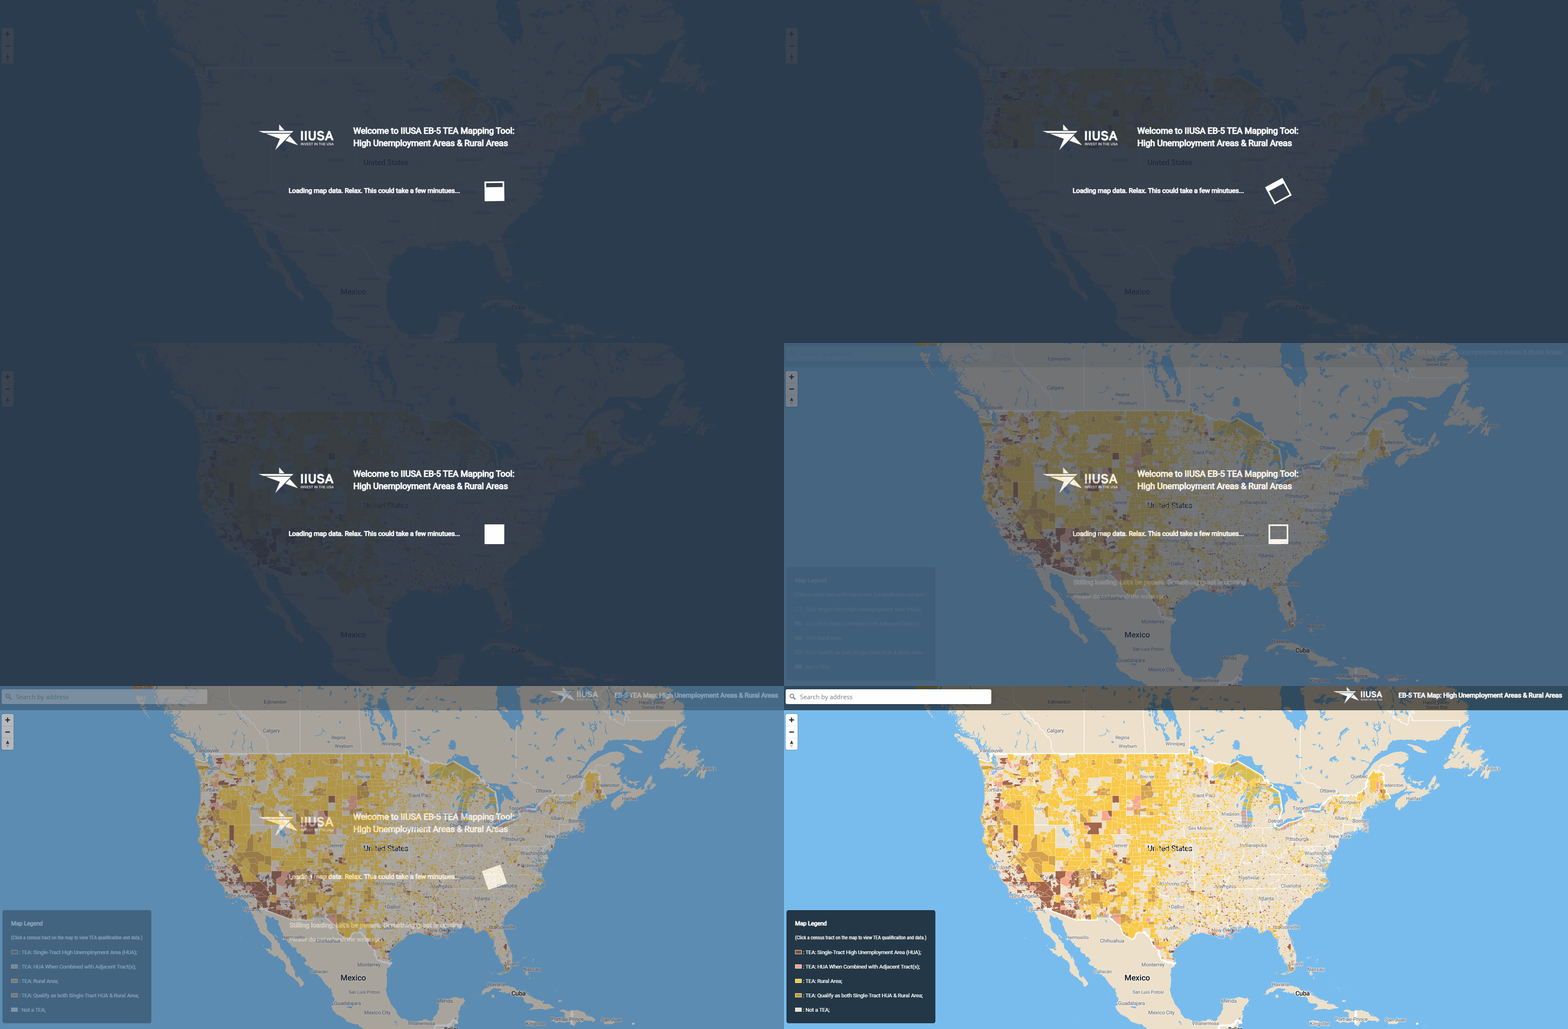
Based on the latest data from the Census Bureau (ACS 2019 5-year estimates) and the newest unemployment statistics from the Bureau of Labor Statistics (LAUS 2020 1-year data), this new EB-5 TEA mapping tool visualizes all of the census tracts that would qualify as a TEA across the country, including:
- Single-census-tract high unemployment areas,
- Census tracts that qualify as a TEA by combining adjacent high unemployment tracts (a method that was introduced by the EB-5 regulatory reform effective in November 2019); and
- Rural areas.
Explore the EB-5 TEA Mapping Tool
Note: It could take a few minutes for the TEA mapping tool to load when you use it for the first time due to the massive amount of data. Please do not refresh your screen, grab a coffee, relax, and let the magic happen.
Key Features of this New Interactive Resource
 |
Search a state, a city or specific address in the U.S. – any location you wantYou can search any location in the U.S., whether it’s a specific address or the name of a city. Once you enter the address and select a location in the search bar, the map will take you to the search result and show you the census tracts that would qualify as a TEA in searched area. You can also click on any census tract on the map to view TEA qualification and more detailed data.
|
|
 |
View all qualified TEAs in any locationThis map visualizes all of the 18,000+ census tracts that qualify as a single-census-tract high unemployment area (dark red areas on the map) as well as the 10,990+ tracts that qualify as a rural area across the country. In addition, this new mapping tool also shows all of the 23,100+ census tracts that qualify as a TEA by combining adjacent census tracts that experience a high unemployment rate (light red areas on the map), a new methodology to determine a TEA that was introduced by the EB-5 regulatory reform that went into effect in November 2019.
|
|
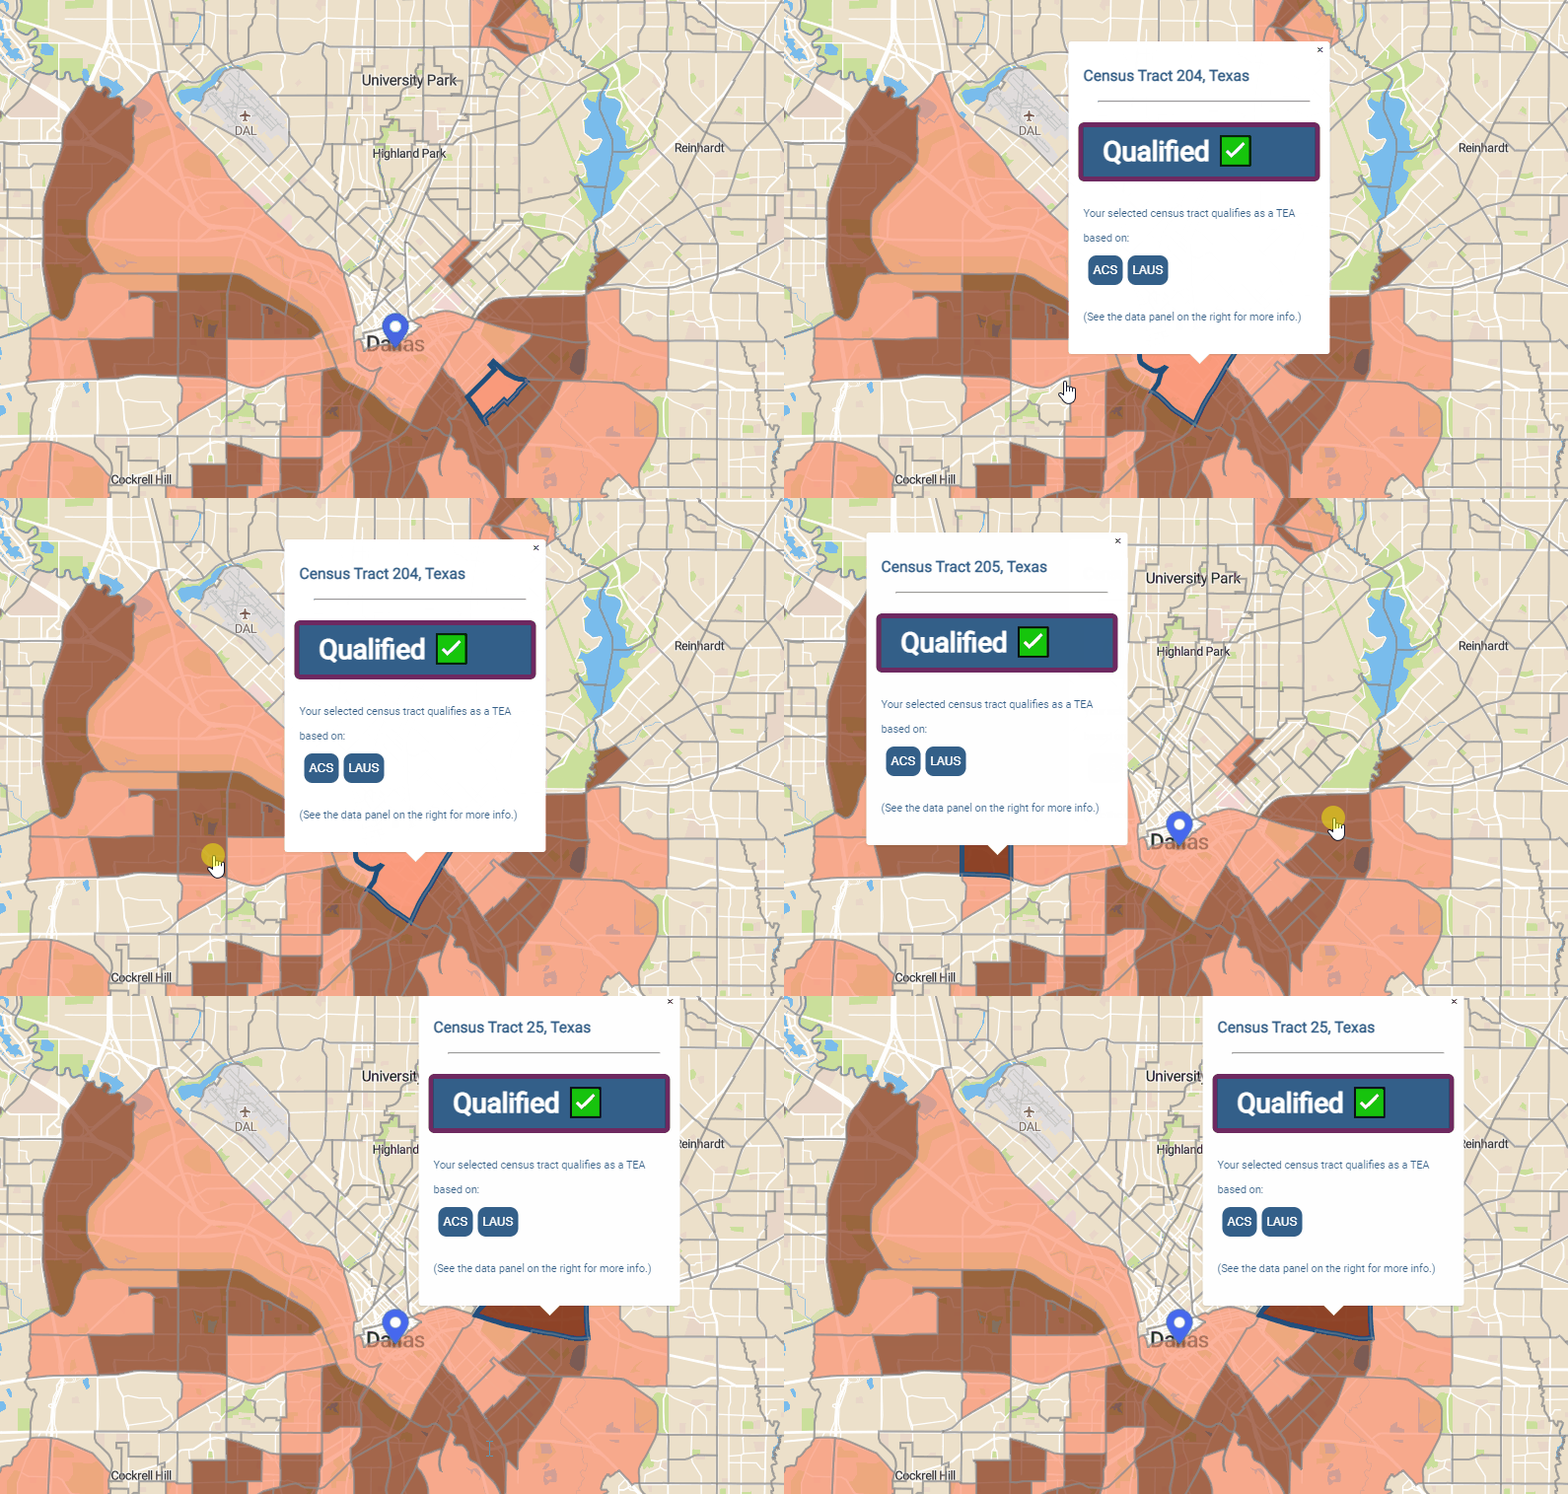 |
Quick tooltips to show a census tract TEA qualification summaryWhen you click on any census tract on the map, a tooltip will pop-up on the screen which quickly tells you whether the selected census tract would qualify as a TEA based on the latest ACS 5-year estimates and LAUS 1-year unemployment rate. Furthermore, the tooltips also inform you of the data source on which the TEA qualification is based.
|
|
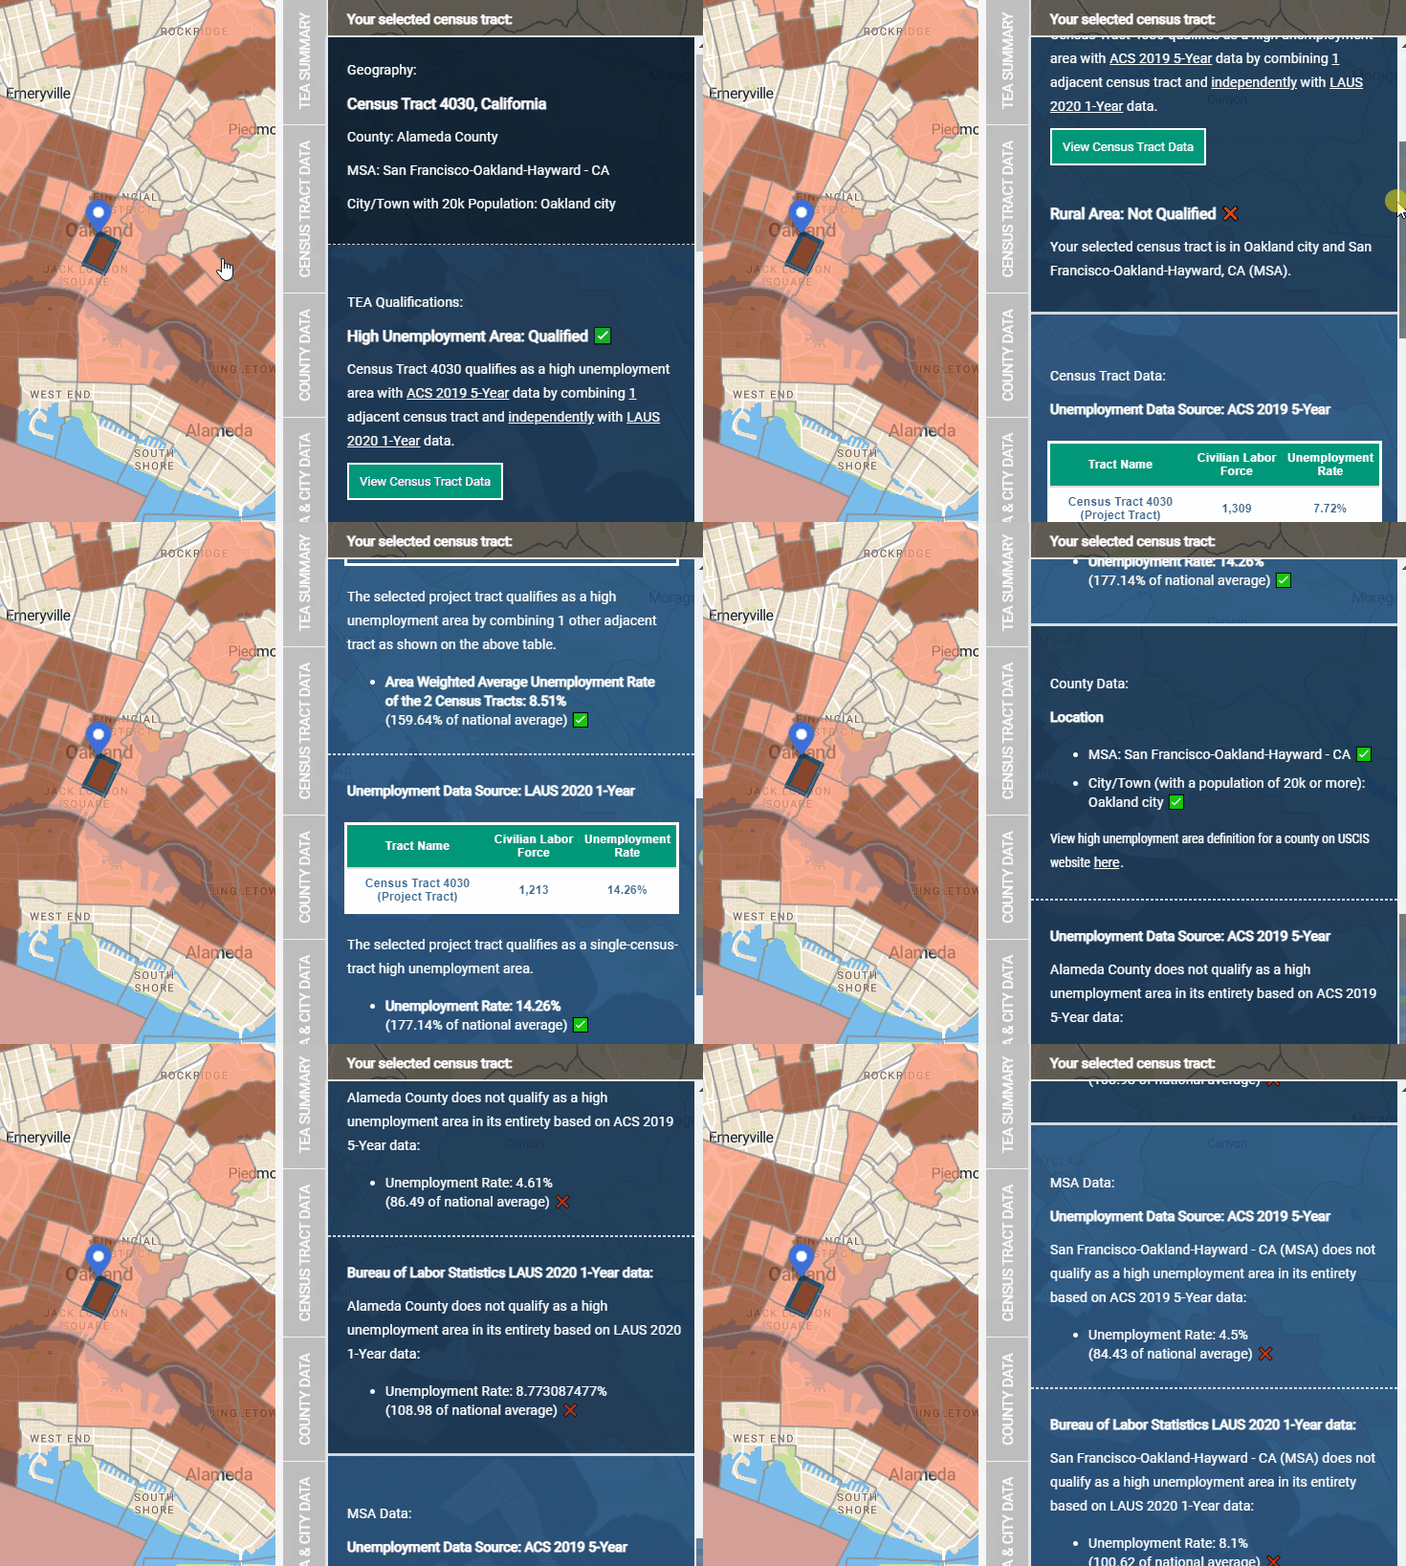 |
In-depth data panel that brings you all pertinent informationWhen you click on any census tract on the map, the data panel on the right side of the map will populate in-depth data to inform you of the pertinent information including:
|
|
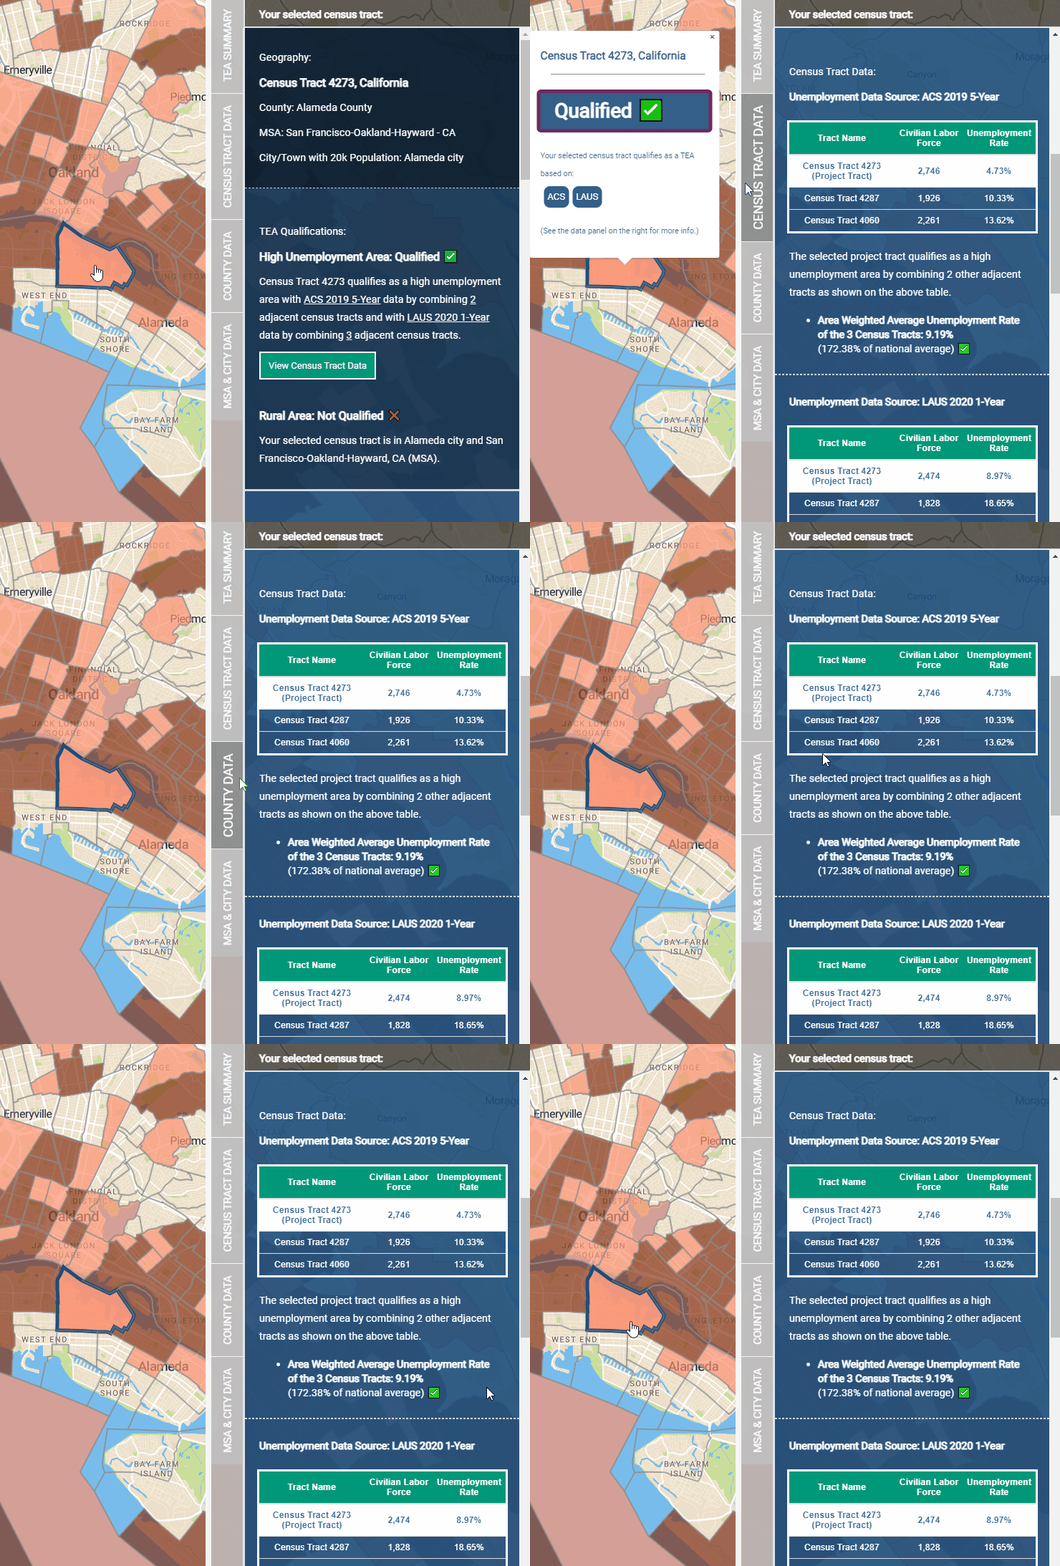 |
Comprehensive unemployment data for each census tract constituting a TEAUnder the Census Tract Data section on the data panel, you can find the latest employment statistics of any selected census tract based on the ACS 2019 5-year estimates from the Census Bureau and the LAUS 2020 1-year data from BLS. Furthermore, if the selected project tract qualifies as a TEA by combining its adjacent census tracts, the data panel will show you a table of comprehensive unemployment data of each tract that constitutes the TEA, including the project tract and the adjacent high unemployment tract(s), along with the weighted average unemployment rate of the aggregated area.
|
|
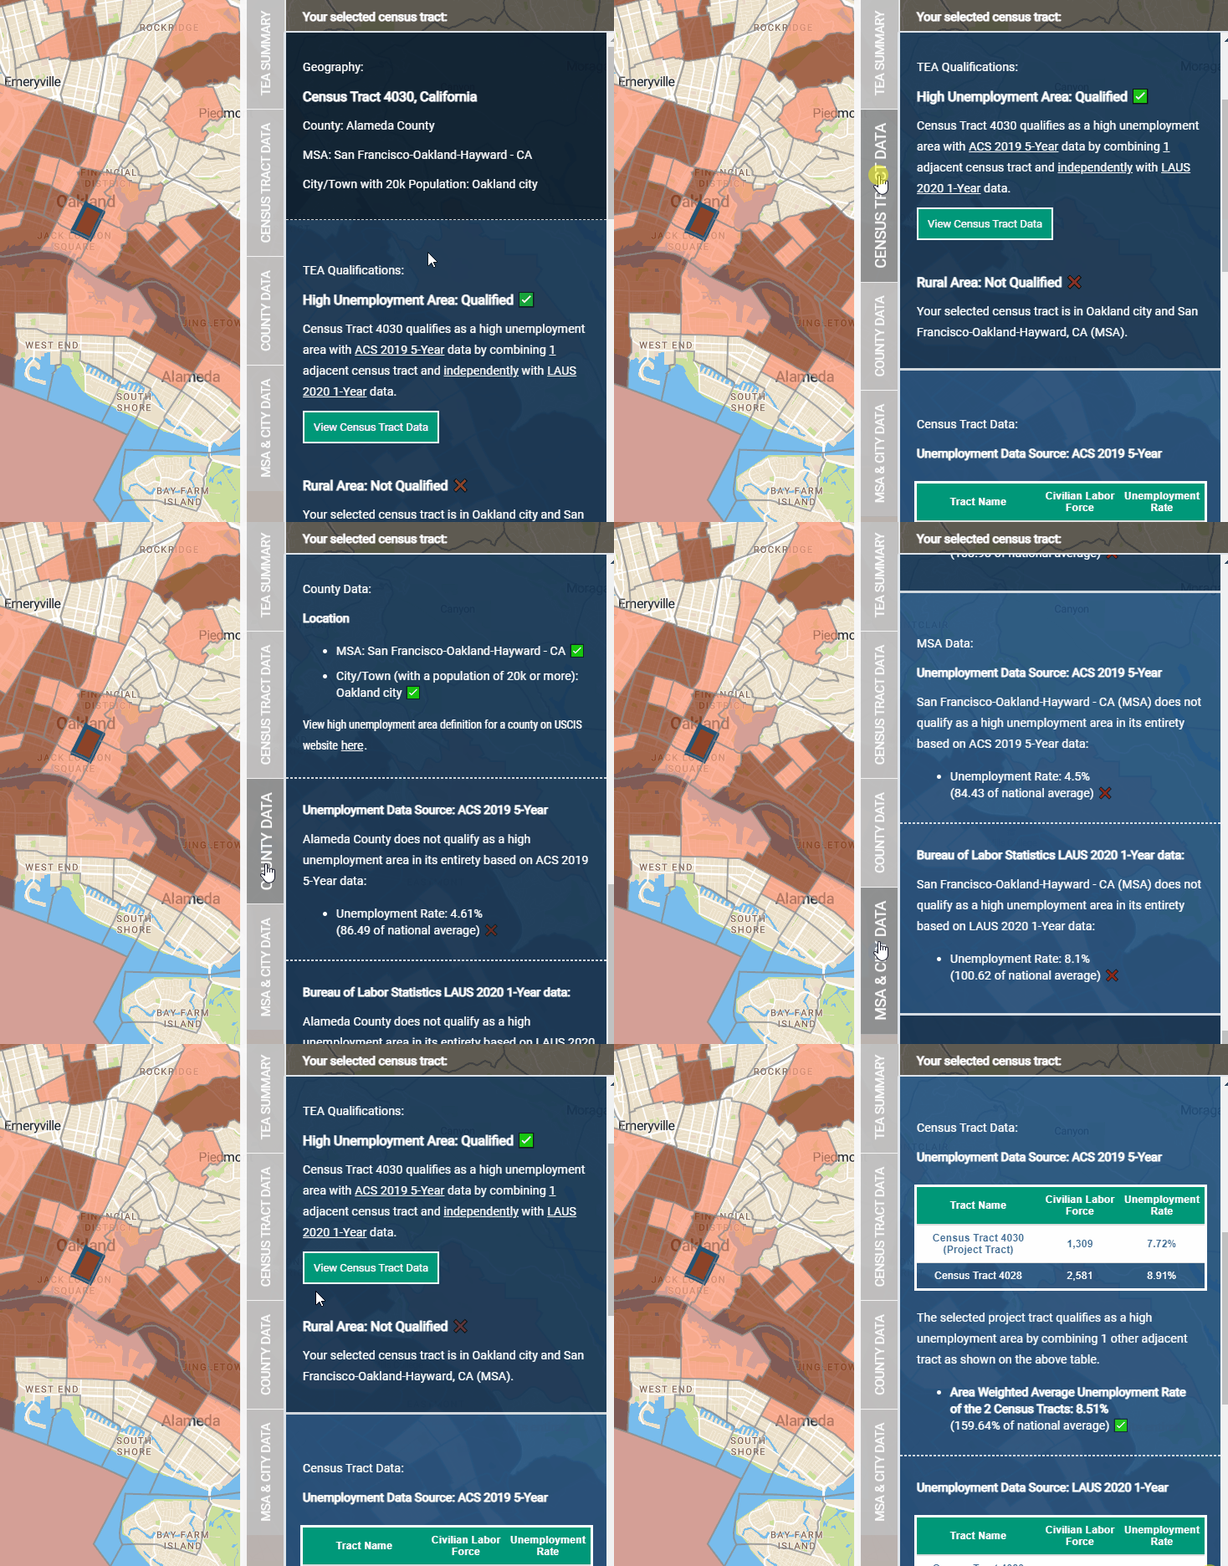 |
A new intuitive sidebar that helps you navigate in-depth TEA dataAs USCIS allows a TEA to be a census tract, a group of census tracts, a city or town, a county, or an MSA as long as the area meets certain criteria, this new mapping tool includes employment statistics on all these geography levels, allowing you to examine TEA qualification for any area within the U.S. The mapping tool now features a new sidebar next to the data panel to help you easily navigate different sections on the data panel that includes census tract data, county data, MSA and city data.
|
Sponsor this Important Industry Resource
Since we launched the first version of the EB-5 TEA mapping tool in December 2020, the resource has attracted an average of 1,520 pageviews on a monthly basis. More than 1,900 unique users across the U.S. and around the globe (approximately 26% of the map users are based outside of the U.S.) have used our mapping tool to retrieve TEA data and conduct due diligence during their EB-5 project selection process.
We thank you for the support and the tremendous positive feedback to our EB-5 TEA mapping tool. IIUSA will continue to improve the tool and make it free and accessible to everyone in the EB-5 community.
In the meantime, IIUSA is also pleased to now offer sponsorship opportunities for the TEA mapping tool itself. Sponsoring this important resource would highlight your commitment to industry development and grant you exposure to thousands of active users! If you would like to sponsor the tool and support IIUSA continued data analysis work, please email info@iiusa.org or call us at 202-795-9669.
