Mr. Charlie Oppenheim, Chief, Visa Controls & Reporting Division, U.S. Department of State Provides Attendees at the IIUSA EB-5 Industry Forum Key Data Insights on Visa Usage and Trends
At the recent IIUSA & AILA EB-5 Industry Forum we were pleased to welcome Mr. Charlie Oppenheim, Chief of Immigrant Visa Control & Reporting Division at U.S. Department of State, as a Keynote Speaker. Mr. Oppenheim provide conference attendees with his insights and critical information on his predictions for visa numbers and retrogression.
Last week, IIUSA published the the presentation materials from Mr. Oppenheim’s panel which can be reviewed here. Staff has also been hard at work producing an in-depth analysis of the statitics Mr. Oppenheim shared with us. Below you will find key insights as well as a comprehensive IIUSA report.
Read the Full IIUSA Data Analysis
Key Data Points:
Consulate Processing vs. Adjustment of Status: In FY2018, 81.3% of the EB‐5 visas were issued via consulate processing at Department of State Foreign Service Posts overseas, indicating that over 81% of the EB‐5 visa applicants physically resided in their home country before receiving their EB‐5 green card in FY2018.
Investment Type: Between FY2008 and FY2018, on average, nearly 93% of the EB‐5 visa holders obtained their green card by investing through an EB‐5 Regional Center project located in a targeted employment area (“TEA”). In addition, stand‐alone investments in a TEA project (“$500k Stand‐Alone TEA”) accounted for nearly 4% of the EB‐5 visa numbers used in FY2018.
Visa Usage by Country of Chargeability (FY 2018): Although China remains the largest country in terms of EB‐5 visa usage, it was only able to receive 48.3% of the total EB‐5 visa annual allocation in FY2018, down from over 75% for the last seven years. In contrast, Vietnam continued to increase its usage of EB‐5 visas and reached its annual per‐country cap (7.1%) for the first time in FY2018. Moreover, 6.1% of the FY2018 EB‐5 visa number was used by Indian visa applicants, a substantial growth from 1.7% in FY2017.

Visa Usage by Countries Other Than China: In FY2018, 693 EB‐5 visas were used by applicants from Vietnam, a growth of 47% from FY2017. In addition, it was the first time that Vietnam reached its annual EB‐5 visa per‐country cap. Additionally, 585 EB‐5 visas in FY2018 were allocated to applicants from India.
Principal Investors: On average, approximately 36% of the EB‐5 visas that were used by Chinese applicants between FY2015 and FY2018 were issued to principal investors. In contrast, I‐526 petitioners (principal investors) from Vietnam only accounted for 27% of all the EB‐5 visas used by Vietnamese visa applicants, indicating on average each principal investor from Vietnam could use up to 4 EB‐5 visas, the lowest ratio among all EB‐5 investor markets.
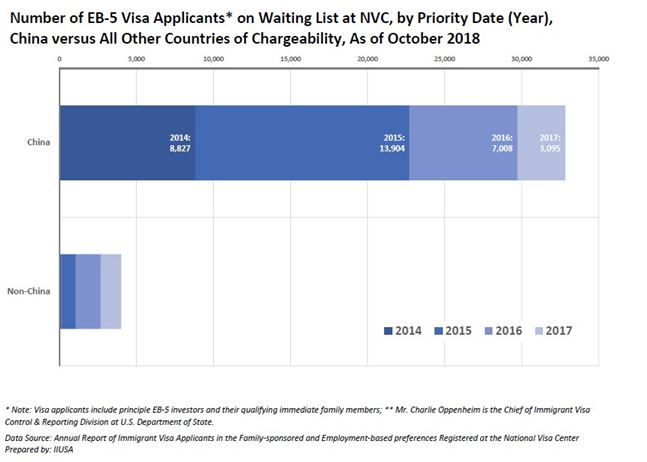
EB-5 Visa Applicants Pending at NVC: A total of 36,839 EB‐5 visa applicants (including principal investors and qualified family members) pending at the National Visa Center (NVC) as of October 31, 2018, a year-over-year growth of 22%