
IIUSA launched a new version of the free EB-5 TEA Mapping Tool a month ago and we are excited to report that the tool already attracted over 6,000 users in the past 30 days! This free resource features in-depth TEA data with an easy-to-use interface, enabling users to check the TEA qualification for every location in the nation.
Performance data since April 22 when the tool was launched:
- 13,500+ Total Pageviews:
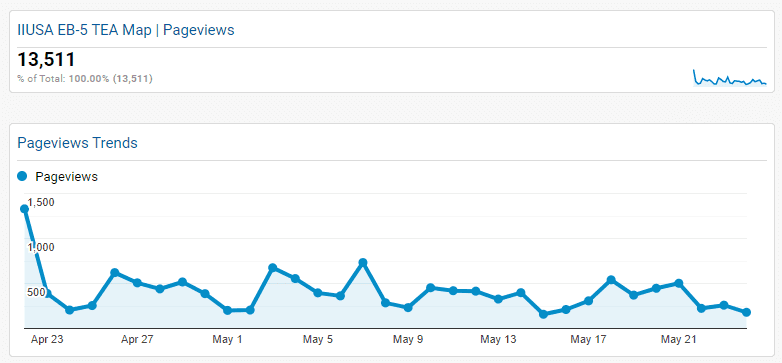
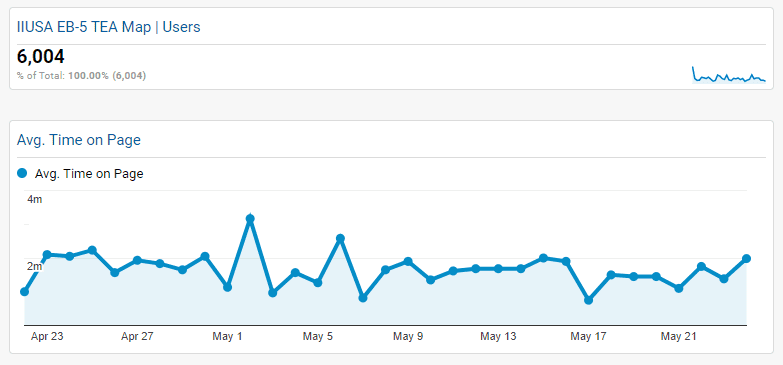
- 6,000+ Users:
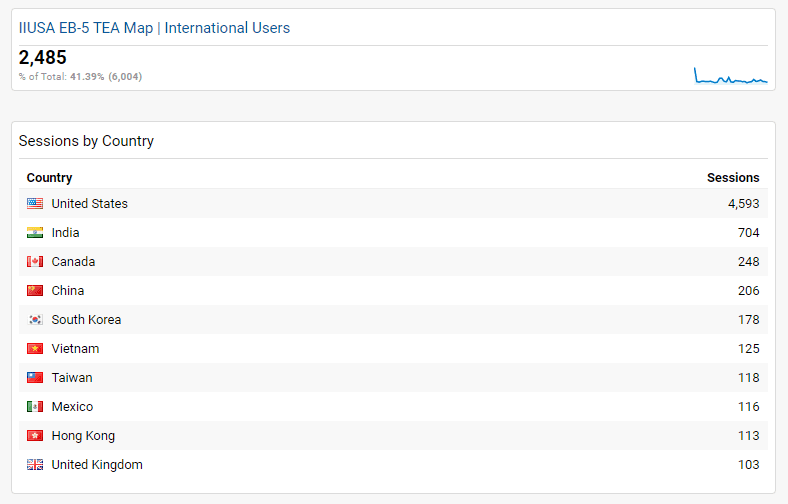
- 2,480+ International Users in over 90 countries:
Now You Can Sponsor This Important Tool
We are honored to have received such great feedback in such a short time. Now we want to give members the opportunity to sponsor this critical industry resource. Your sponsorship ensures that the IIUSA team is able to continue its data analytics work but also grants your company exposure to thousands of active users.
Sponsorship benefits include:
- Branding on the TEA Mapping Tool;
- Recognition on IIUSA.org as a Data Resource Sponsor;
- Inclusion in all forthcoming TEA Mapping Tool marketing campaigns
To learn more about sponsorship opportunities please email info@iiusa.org or call (202) 795-9667.
![]()
Key Features of this New Interactive Resource
Explore IIUSA’s EB-5 TEA Mapping Tool Here.
 |
Search a state, a city or specific address in the U.S. – any location you wantYou can search any location in the U.S., whether it’s a specific address or the name of a city. Once you enter the address and select a location in the search bar, the map will take you to the search result and show you the census tracts that would qualify as a TEA in searched area. You can also click on any census tract on the map to view TEA qualification and more detailed data.
|
|
 |
View all qualified TEAs in any locationThis map visualizes all of the 18,000+ census tracts that qualify as a single-census-tract high unemployment area (dark red areas on the map) as well as the 10,990+ tracts that qualify as a rural area across the country. In addition, this new mapping tool also shows all of the 23,100+ census tracts that qualify as a TEA by combining adjacent census tracts that experience a high unemployment rate (light red areas on the map), a new methodology to determine a TEA that was introduced by the EB-5 regulatory reform that went into effect in November 2019.
|
|
 |
Quick tooltips to show a census tract TEA qualification summaryWhen you click on any census tract on the map, a tooltip will pop-up on the screen which quickly tells you whether the selected census tract would qualify as a TEA based on the latest ACS 5-year estimates and LAUS 1-year unemployment rate. Furthermore, the tooltips also inform you of the data source on which the TEA qualification is based.
|
|
 |
In-depth data panel that brings you all pertinent informationWhen you click on any census tract on the map, the data panel on the right side of the map will populate in-depth data to inform you of the pertinent information including:
|
|
 |
Comprehensive unemployment data for each census tract constituting a TEAUnder the Census Tract Data section on the data panel, you can find the latest employment statistics of any selected census tract based on the ACS 2019 5-year estimates from the Census Bureau and the LAUS 2020 1-year data from BLS. Furthermore, if the selected project tract qualifies as a TEA by combining its adjacent census tracts, the data panel will show you a table of comprehensive unemployment data of each tract that constitutes the TEA, including the project tract and the adjacent high unemployment tract(s), along with the weighted average unemployment rate of the aggregated area.
|
|
 |
A new intuitive sidebar that helps you navigate in-depth TEA dataAs USCIS allows a TEA to be a census tract, a group of census tracts, a city or town, a county, or an MSA as long as the area meets certain criteria, this new mapping tool includes employment statistics on all these geography levels, allowing you to examine TEA qualification for any area within the U.S. The mapping tool now features a new sidebar next to the data panel to help you easily navigate different sections on the data panel that includes census tract data, county data, MSA and city data.
|