On December 14, 2024, the Census Bureau released the 2019-2023 American Community Survey (ACS) 5-year estimates, which include updated unemployment rates for each census tract and the nation, reshaping targeted employment areas (TEA) in urban cities.
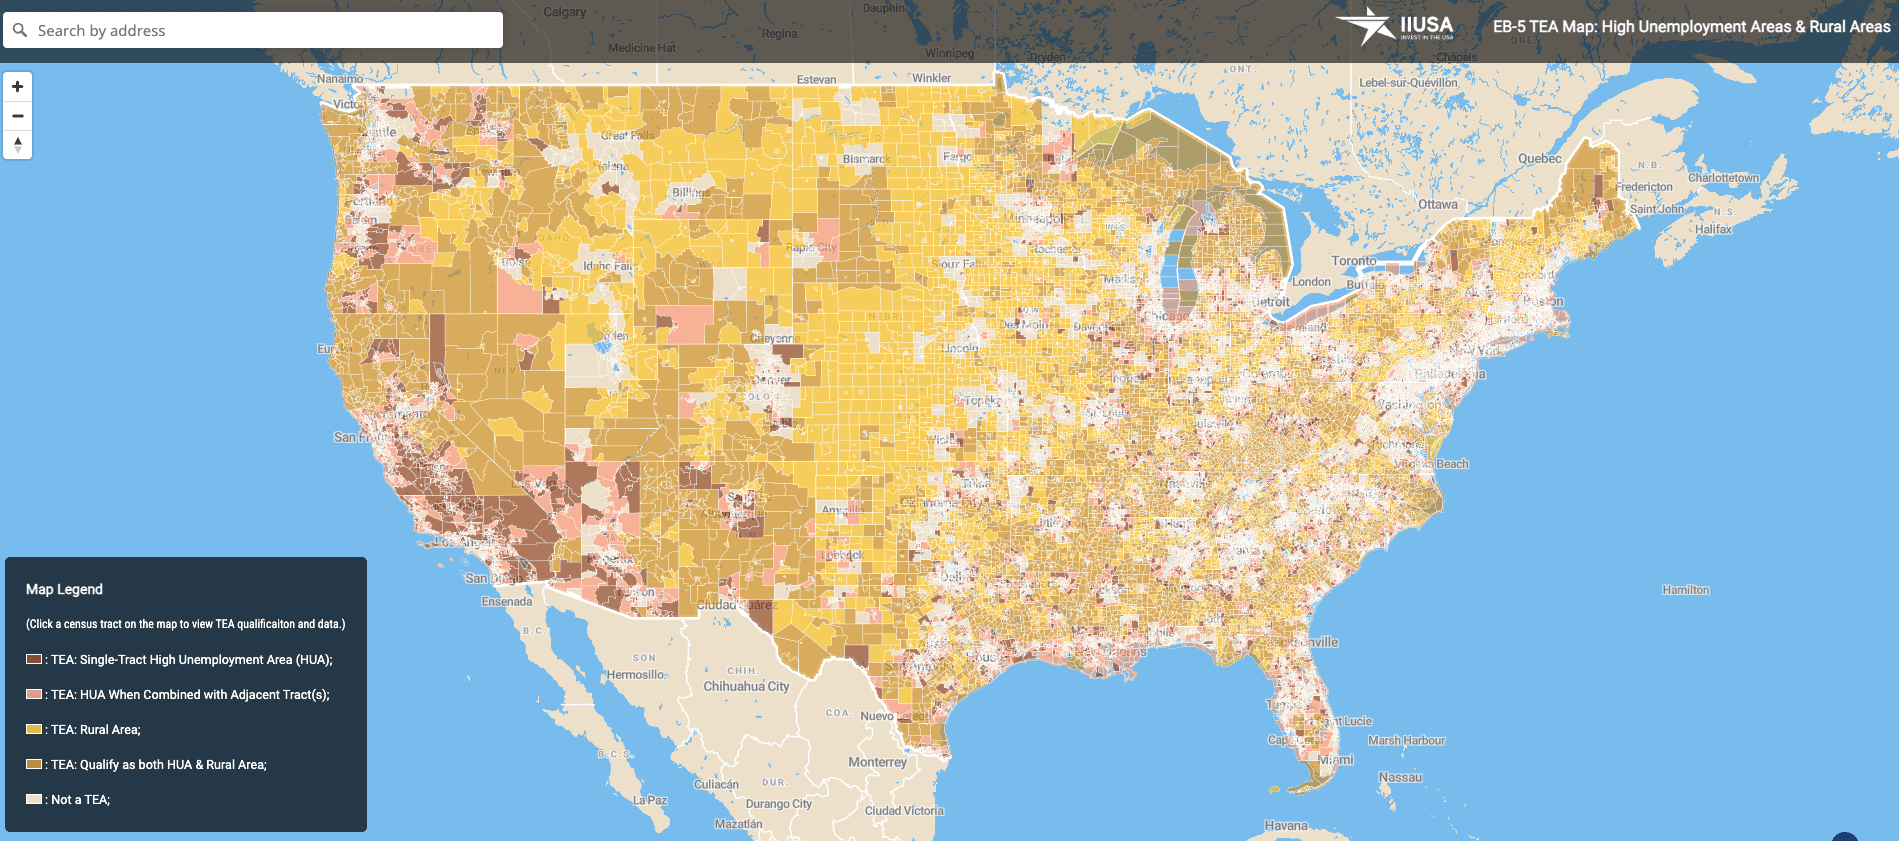
Following the release of the latest data, IIUSA updated its online EB-5 TEA Mapping Tool and published a data report to further analyze how the new ACS 2019-2023 unemployment rates affect the distribution of EB-5 High Unemployment Areas (HUA or “urban TEA”) across the country. The new ACS data does not impact rural areas.
National Unemployment Rate Trend
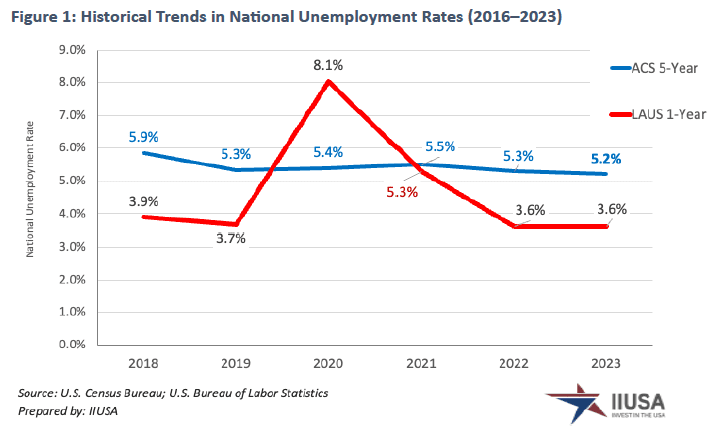
According to the latest ACS 5-year data, the national unemployment rate decreased by 0.1%, dropping to 5.2% between 2019 and 2023. Consequently, the benchmark for a census tract or contiguous census tracts to qualify as an HUA based on ACS data has slightly adjusted to 7.80%. Below is a year-over-year comparison of national average unemployment rates based on ACS data versus LAUS data (an alternative source for TEA qualification):
High Unemployment Areas Across the Country
Based on the ACS 2019–2023 5-year estimates, more than 38,700 census tracts across the 50 states and the District of Columbia qualify as an HUA, representing approximately 46% of the nation’s census tracts (excluding territories). Compared to the ACS 2018–2022 5-year data, an additional 255 census tracts in various states and the District of Columbia now qualify as an urban TEA under the new ACS data. Table 1 below provides a summary of HUA census tracts using the ACS 2019-2023 data compared to the ACS 2018–2022 data. Census tracts that qualify as HUAs under the Local Area Unemployment Statistics (LAUS) from the Bureau of Labor Statistics (BLS) are not included here.
Urban TEA Changes by State & by Major City
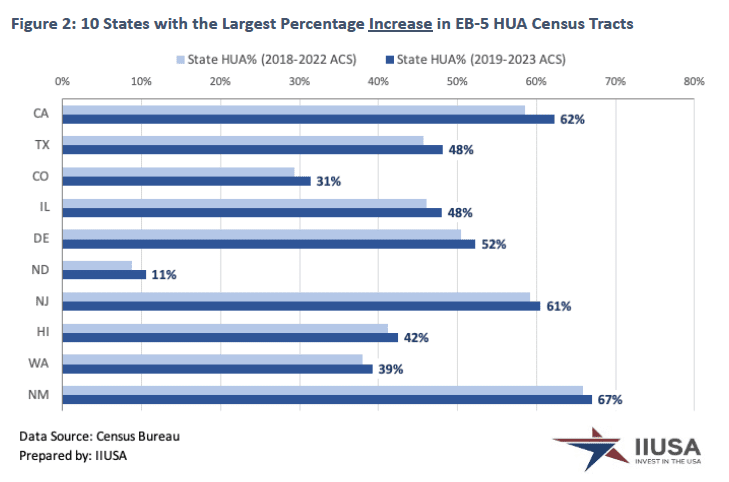
The new unemployment data from the ACS has altered the distribution of urban TEAs across the country, revealing new HUA opportunities in various states and cities. For example, states including Nevada, Louisiana, New Mexico, Mississippi, California, and New Jersey each have more than 60% of their census tracts qualifying as HUAs under the latest 2019-2023 ACS data. Additionally, California, Texas, Colorado, Illinois, New Jersey, and Washington experience the highest percentage increases in HUA census tracts based on the new ACS estimates.
Major cities such as Newark, NJ; Detroit, MI; and Cleveland, OH, have more than 95% of their census tracts qualifying as HUAs based on the 2019-2023 ACS unemployment data. Among cities that traditionally have the highest EB-5 activity, Los Angeles, CA, and New York, NY, both see an increase in the percentage of the city’s HUA census tracts under the new ACS 5-year estimates.
For more in-depth analysis, click the button below to download the full report.
IIUSA EB-5 TEA Mapping Tool
IIUSA’s EB-5 TEA Mapping Tool (https://iiusa.org/eb5_tea_mapping_tool) has been updated with the latest unemployment data from both ACS and LAUS, incorporating the 2019–2023 ACS 5-year estimates.
Among its many features, the free EB-5 TEA Mapping Tool allows users to:
- Search any location in the U.S. to determine TEA qualification.
- Explore all TEA opportunities within a specific area (city, county, MSA, or state).
- Identify whether a location qualifies as a single-tract high unemployment area, multi-tract high unemployment area, or rural area.
- Access the latest ACS and LAUS employment statistics for any census tract.
