By Lee Li, Policy Analyst, IIUSA
Raising EB-5 capital worldwide has proven to be an increasingly challenging endeavor. As the industry trade association, IIUSA is committed to publishing the latest intelligence on EB-5 investor markets and proactively seeking data via Freedom of Information Act (FOIA) requests about statistics on investors’ country of birth. In June 2017, IIUSA obtained a dataset from the U.S. Citizenship & Immigration Services (USCIS) FOIA office that included Form I-526 (Immigrant Petition by Alien Entrepreneur) filings approval and denial statistics for fiscal year (FY) 2016 by petitioner’s country of origin. Despite some minor discrepancies in USCIS’s data , the latest I-526 statistics illustrate new and exciting trends that will help project marketers make informed decisions on where to invest their time and money raising EB-5 capital.
TOP 15 EB-5 INVESTOR MARKETS IN 2016
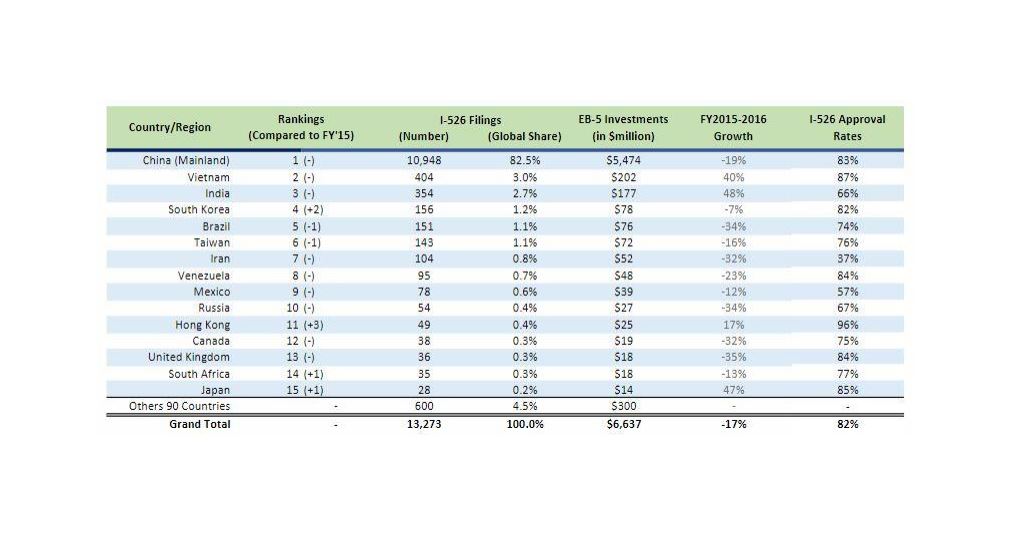
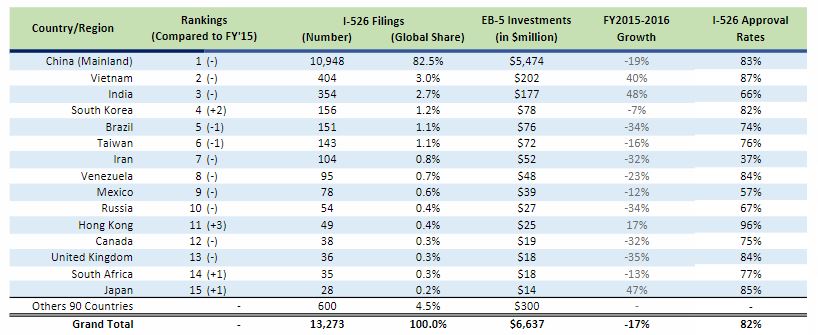
Approximately 95% of all I-526 filings in FY2016 came from the top 15 EB-5 investor markets (listed in Table 1), representing more than $6.3 billion in potential capital investment for various economic development projects across the U.S. Although its global share in I-526 filings declined by 2.5% from FY2015, investors from Mainland China remained the top participants in the EB-5 Program, accounting for 10,950 I-526 filings (82.5% of all I-526 petitions filed) in FY2016. Coming in second and third place were Vietnam and India, respectively, remaining in the same position as FY2015.
A surprising change was South Korea, which saw a bump of two spots from FY2015 to fourth rank in FY2016. Meanwhile, Brazil saw a 30% decline in number of I-526 petitions filed in FY2016, and is now ranked as the fifth most popular EB-5 investor marketplace. Another highlight was the downward movement of Nigeria, which experienced a decline of almost 60% in I-526 filings in FY2016 and dropped out of the top 15 investor markets in FY2016. In FY2015, Nigeria was ranked 11th for EB-5 investor markets.

