
IIUSA recently received country-specific statistics of Form I-526 (Immigrant Petition by Alien Investor) for the first quarter (Q1) and the third quarter (Q3) in federal fiscal year (FY) 2019. Enjoy the EB-5 investor market trends data below.
With this new data set, IIUSA published a members-only data report, analyzing the latest EB-5 investor market trends across the globe including the latest demands for EB-5 visas in various investor markets, I-526 adjudications by investor’s country of birth, average I-526 approval rates for investors from different countries, and more.
Click here to download the full report (IIUSA members-only).
As visualized on eight (8) data charts in the full report, key updates on the latest EB-5 investor market trends include:
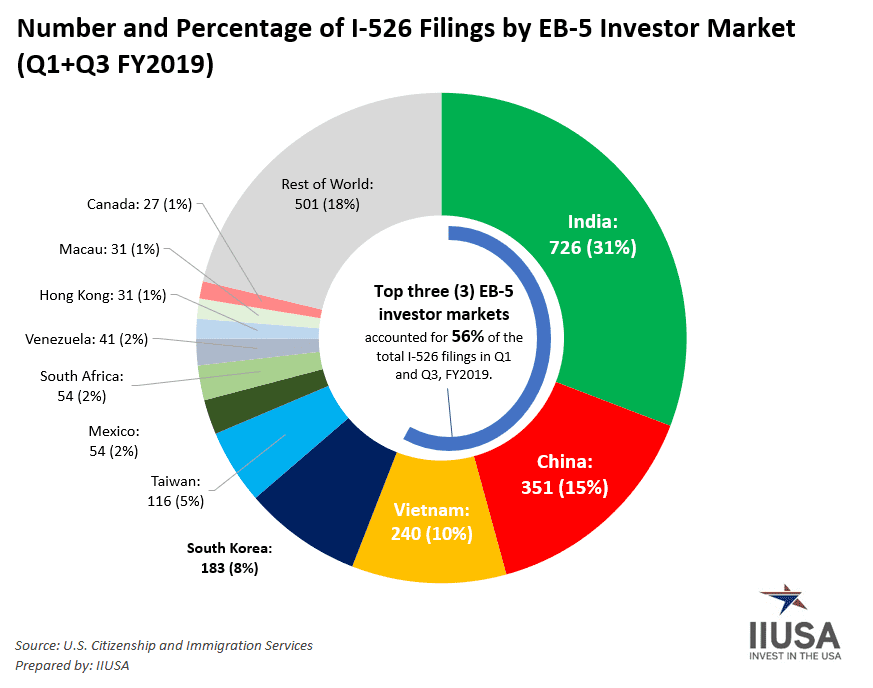
- India became the largest EB-5 market with the highest number of I-526 filings in Q1 and Q3, FY2019. I-526 filings from Indian investors were more than double of the I-526 filings from Chinese investors during that time period.
- The numbers of I-526 filings from China and Vietnam in FY2019 (Q1 and Q3) were down by 76% and 42% respectively from FY2018, indicating the impact of visa retrogression has become increasingly significant on reducing the demands for EB-5 visas in the backlogged countries.
- Among other “rising stars,” EB-5 investor markets such as Argentina, South Africa, Nigeria, Columbia and Egypt experienced a over 50% growth between FY2018 and FY2019.
- USCIS adjudicated 56% fewer I-526 petitions in Q1 and Q3 FY2019. However, the overall reduction in I-526 productivity had a different impact on different I-526 cases filed by investors from different origins. In particular, our analysis found that I-526 adjudications for investors from China had the biggest decline between 2018 and 2019, while USCIS actually processed a higher number of I-526 cases filed by investors from certain countries (such as India, South Korea, etc.) in Q1 and Q3, FY2019.
- EB-5 investors from South Korea, Japan and South Africa saw the highest I-526 approval rate in Q1 and Q3 FY2019 comparing to other top EB-5 markets; while I-526 approval rates for investors from China and Mexico were lower than worldwide average in FY2019.
- Lastly, our analysis also investigated the country-specific I-526 denial trends in Q3, FY2019, when the worldwide I-526 approval rate was only 58% – a significant drop based on USCIS’ quarterly Form I-526 statistics.
The following animation illustrated the rise of the EB-5 investor market in India since FY2014: