
IIUSA’s 2015 EB-5 Investor Markets Report: A Quantitative Analysis of EB-5 Foreign Direct Investment (FDI) by Country & Region (Vol. 3, Issue 3, October 2015)
by Lee Li, IIUSA Policy Analyst and Allen Wolff, IIUSA Executive Director of Marketing & Communications

The influx of EB-5 capital into the U.S. economy is growing at a record pace. According to data released by the United States Citizenship and Immigration Services (USCIS), foreign direct investment (FDI) through the EB-5 Program totaled over $1.4 billion dollars in the third quarter of FY2015. Or, in other words, USCIS approved 2,868 I-526 Immigrant Petition by Alien Entrepreneur in Q3, shattering the Program record.
As the EB-5 industry trade association, IIUSA is well-positioned to help its member make sense of this macro-level data so that it can inform their decisions in the marketplace. With this in mind, IIUSA recently published its first ever EB-5 Investor Markets Report (The “Report”), bringing into focus the countries and regions poised for growth in the years ahead.
The 2015 EB-5 Investor Markets Report is a comprehensive quantitative analysis of EB-5 investor trends whereby every country in the world with market data is assigned a “growth score”, allowing us to compare trends of various countries and regions against the average growth of the industry over various timespans.
The Methodology
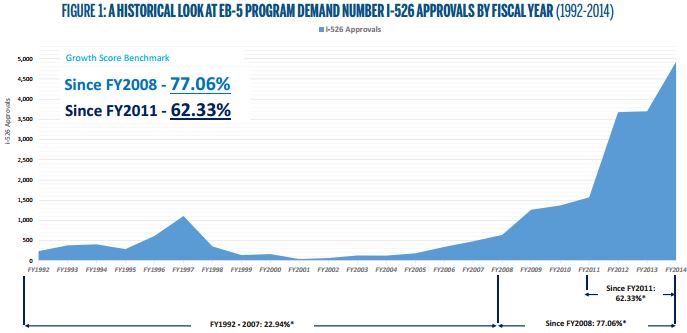
Through Freedom of Information Act (FOIA) disclosures of I‐526 approval data by investor origin, IIUSA has accumulated a complete historical dataset for the years FY1992 through FY2014 (and will obtain FY2015 data when it becomes available). This treasure-trove of data allows us to analyze I-526 approvals in aggregate and helps us trace the remarkable growth of the EB-5 Program since its creation over two decades ago.
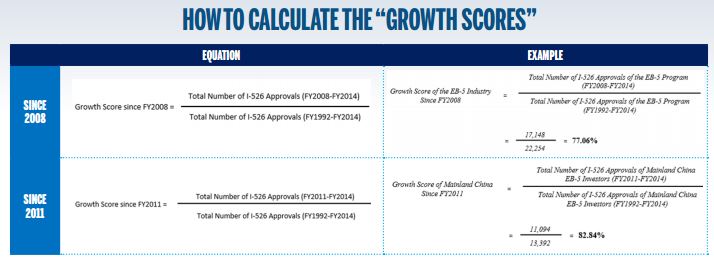
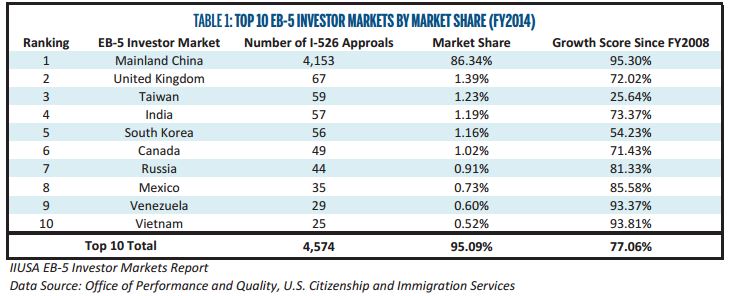
As Figure 1 illustrates, the EB-5 Program experienced its most significant growth year-over-year since FY2008 (i.e., post great recession). From the data, we can ascertain that 77.06% of all I-526 approvals occurred within the past seven year. This 77.06% is our first benchmark by which we compare country and regional growth since FY2008. A second significant increase can be observed between FY2011 and FY2014 where 62.33% of all I-526 approvals took place. With these benchmark growth scores in toe (77% since 2008 and 62% since 2011) there is now a barometer by which one can determine whether a country or region is truly on the rise.
The Pros and Cons of the “Growth Score” Calculation
Pros:
• Multi-year & Repeatable – This methodology can be easily duplicated year-over-year and produce consistent results. The benchmark growth score will reflect the overall trends of the Program and emphasizes the most recent fiscal year data.
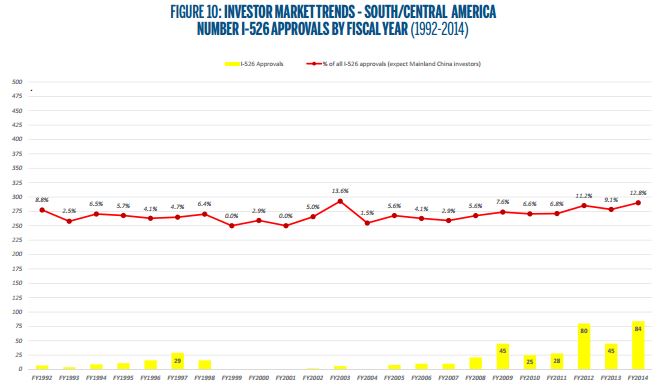
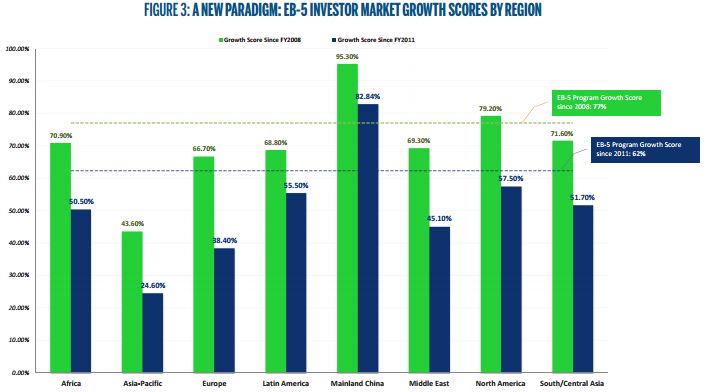
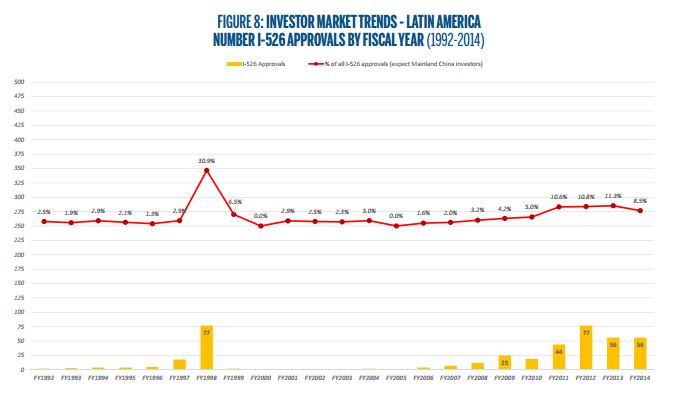
• Regional & Country-specific analysis – Using the growth score model, we can now compare demand trends for individual countries across the world. By analyzing these growth scores in segments (i.e. since FY2008 or FY2011), we can also pinpoint exactly when in time certain countries or regions have seen a change in overall demand. For instance, since 2008, Latin America has growth score of just over 68% which is less than the 77% overall Program benchmark average. However, a more granular focus on the region reveals that individual countries such as Venezuela (93%) Columbia (71%) or Brazil (82%) have exceed both the regional and global benchmark averages and thus are countries that should be paid extra attention by those seeking EB-5 capital.
Cons:
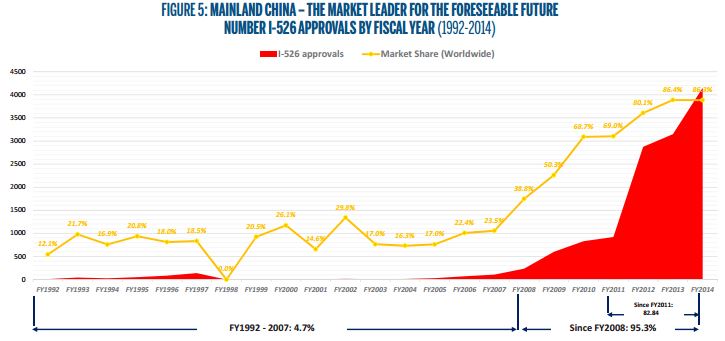
• Petition Volume: When “scoring” countries and regions based on their growth, we have no control for volume, which is also a critical determinant for whether a market has a healthy share of potential investors. For example, Taiwan ranks third among all countries globally in FY2014 in terms of overall market share, yet its growth score lags significantly behind the rest of the top 10 markets at just over 25%. This is because the number of I-526 approvals from Taiwan pre-FY2008 was so high (reaching a high-water mark of 233 investors in FY1997) that Taiwan’s growth score over the past seven years does not compare favorably with its popularity in the early years of the EB-5 Program.
• Benchmark Averages Includes Mainland China – We know that EB-5 demand over the past seven years has been driven largely by Mainland Chinese investors. In fact, the EB-5 investor market in Mainland China made up 86.34% of the total market share in FY2014 with the next nine highest volume markets combined sharing only 8.75% (as Table 1 indicates). Removing Mainland China from the equation, the overall growth score benchmark average since FY2008 for the rest of the world is actually just over 56%. This is a far more conservative figure when compared to the 77% growth score benchmark average that includes all EB-5 investor markets.
EB-5 Demand
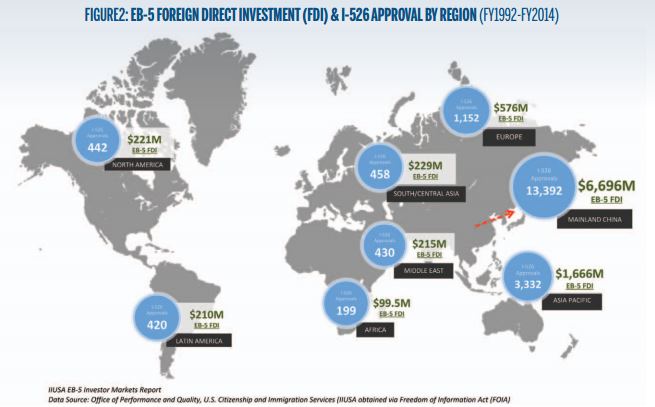
This infographic illustrates global EB-5 market demand for each region since FY1992. Table 1 highlights the top 10 EB-5 investor markets by I-526 approvals market share in FY2014. The complete 50-page EB-5 Investor Markets Report, replete with comprehensive analyses for individual countries, is available exclusively to IIUSA Members at http://member.iiusa.org.
Mainland China is the largest EB-5 investor market by a significant margin, generating a total of 13,390 I-526 approvals since the start of the Program. Since FY1992, Mainland China has accounted for over $6.7 billion in EB-5 foreign direct investment (FDI). In addition, 95% of all I-526 approvals for EB-5 investors from Mainland China took place after FY2008, while 82% of all I-526 approvals occurred within the last four fiscal years. Figure 5 shows Mainland China’s EB-5 market share increasing from 38% in FY2008 to over 86% in FY2014.
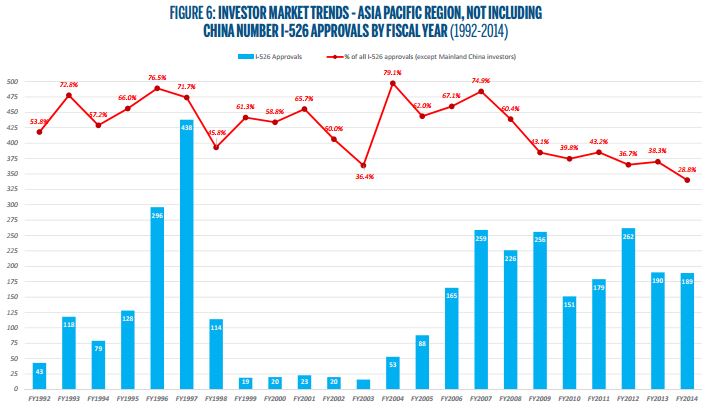
Asia Pacific (excluding Mainland China) is the second largest EB-5 investors. A total of 3,300 I-526 approvals were issued to EB-5 investors from Asia Pacific between FY1992 and FY2014, which accounts for over 1.6 billion in EB-5 FDI. Yet, the Asia Pacific regional EB-5 growth score since 2008 is only 43.5%, among the lowest level among all regions. In addition, its EB-5 market share has been in constant decline, from over 70% in FY2009 to only 28% in FY2014.
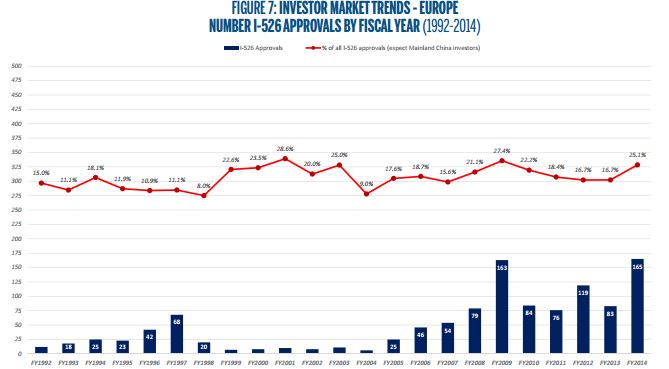
Europe ranks as the third largest EB-5 investor region in terms of total number of I-526 approvals since FY1992. EB-5 demand in Europe is extremely diversified – a total of 39 European countries have generated over 1,150 EB-5 investors accounting for over $576 million in EB-5 FDI. Although Europe’s growth scores are relatively low compared to regions such as Latin America and South/Central Asia, it still generated over 110 EB-5 investors in every year since FY2011.
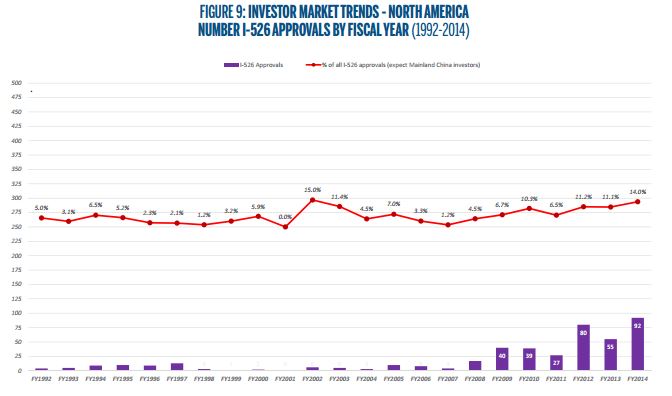
Rest of the World: The EB-5 investor markets of South/Central Asia, North America, Middle East are relatively similar in terms of the number of I-526 approvals since FY1992 – a total of 458, 442, 430 I-526 approvals have been issued to these three regions, respectively.
However, as Figure 3 illustrates, North America is the only region (aside Mainland China) that has a growth score higher than the EB-5 program’s average level since FY2008. Countries such as Mexico and Canada have grown significantly in the past four years.
Want more market insights? Access today at IIUSA.org or contact us at info@iiusa.org.