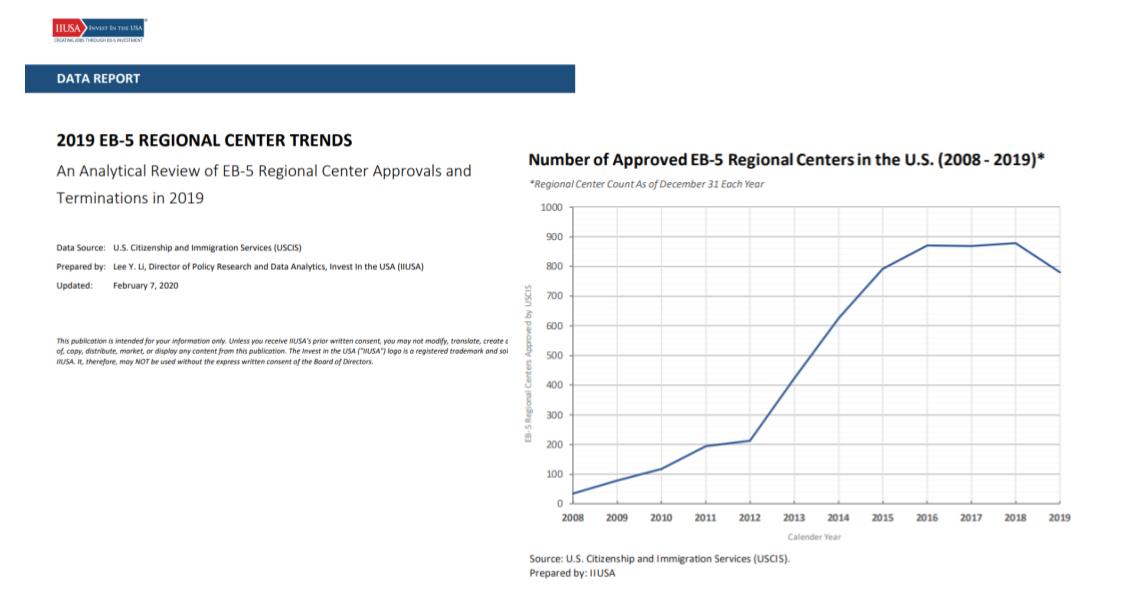
In our latest data report, An Analytical Review of EB-5 Regional Center Approvals and Terminations in 2019, IIUSA takes an in-depth look at the statistics of EB-5 Regional Centers from 2008 and 2019: the growth of Regional Centers, geographical distribution of Regional Center approvals and terminations, the history and life span of EB-5 Regional Centers, and the reasons behind Regional Center terminations.
Read the Comprehensive Report here (Members Only)
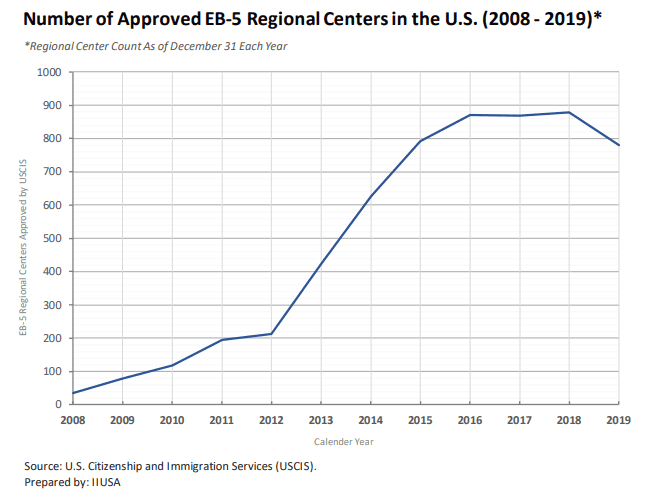
Among other findings, while the number of EB-5 Regional Centers increased for 10 consecutive years between 2008 and 2018, it experienced an annual decline for the first time in 2019. However, we found that EB-5 Regional Centers had the fastest growth between 2012 and 2016 – the time period when we estimated $27 billion in EB-5 capital investment was generated to the U.S. economy, largely facilitated by EB-5 Regional Centers across the country.
In addition, this members-only report also highlights key data trends of EB-5 Regional Centers between 2008 and 2019, including:
- The quarterly approvals and terminations of EB-5 Regional Centers since federal fiscal year 2015;
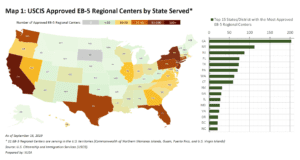
- The number of active Regional Centers serving in each state;
- The year-over-year growth of EB-5 Regional Centers in California, New York, New Jersey, Florida, Texas, and Pennsylvania – the six states with the largest number of approved Regional Centers;
- The length of time most of the approved Regional Centers remained active (spoiler alert: there are two active Regional Centers serving the EB-5 industry for more than 20 years!);
- The geographical distribution of 370+ terminated Regional Centers;
- The states with the highest and lowest Regional Center “termination rate” (the percentage of Regional Centers that were approved in each state but ended up being terminated);
- The life span of terminated Regional Centers; and
- The most common reasons cited on a Regional Center termination letter.
IIUSA members click here to download the comprehensive data report.


