EB-5 Program Generates over $980 Million in Foreign Direct Investment in the Second Quarter of FY2015 (Volume 3, Issue 2, Pg. 38-42)
By Lee Li, IIUSA Policy Analyst
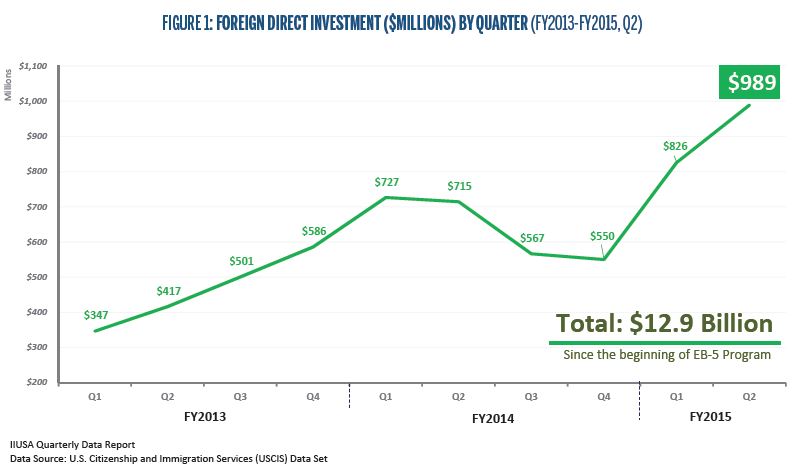
If you were amazed by the record-breaking amount of foreign direct in-vestment (FDI) con-tributed by the EB-5 Regional Center program (the “Program”) in the first quarter of fiscal year (FY) 2015, the latest data for the second quarter will knock you off your seat!
According to U.S. Citizenship and Immigration Services (USCIS), 1,978 I-526 petitions were approved in FY2015 Q2. With a nearly 20% growth from the last quarter, it accounts for over $980 million FDI injected in to various economic development projects that create American jobs. That is over $10 million in capital investment promoting regional development every single day in FY2015 Q2 – another record setting quarter.
The growth is even more significant when comparing year-over-year: 38% growth compared to Q2 in FY2014 and 137% increase compared to the same quarter just two years ago (Figure 1).
In addition, the latest I-526/829 datasets published by USCIS bring to light several data points that illustrate the latest EB-5 adjudication trends. These include:
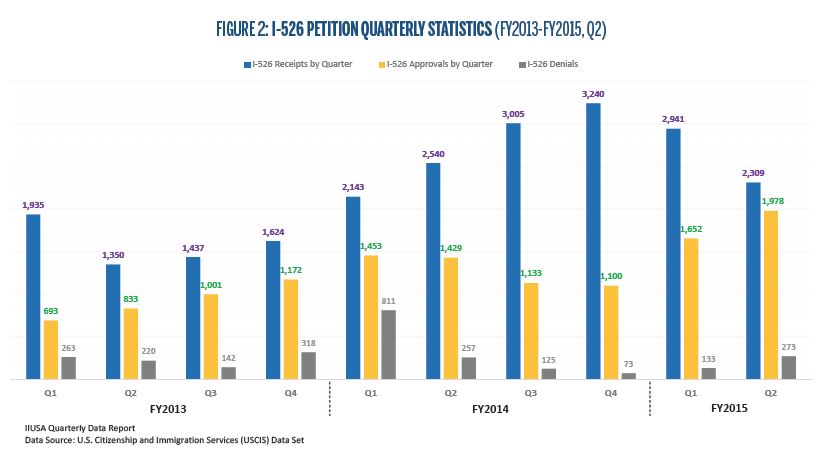
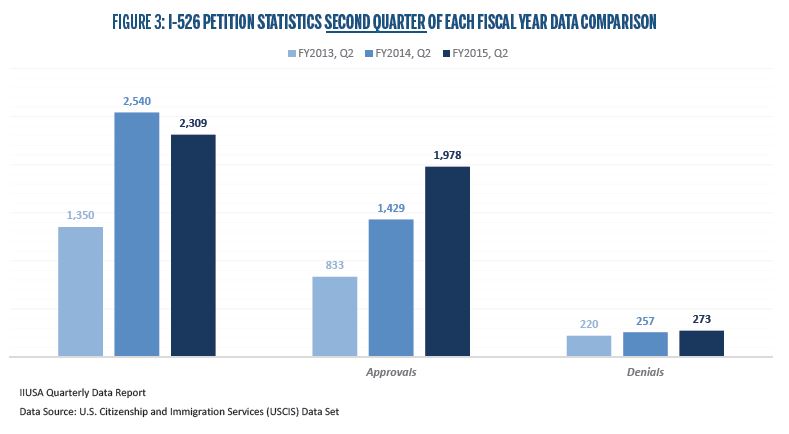
- In FY2015 Q2, a total of 2,309 I-526 petitions were received by USCIS, a decrease of 21% from the first quarter in FY2015. In a year-over-year comparison over the past three years, although the I-526 receipts number declined by 9% compared to FY2014 Q2, it is still higher than the I-526 receipts in FY2013 Q2 by more than 70% (Figure 2 & 3).
- The amount of I-526 petitions pending increased from 13,526 in Q1 to 13,663 in Q2 FY2015. This represents over $6.8 billion in capital investment currently waiting to be deploying into the U.S. economy. However, it should be noted that growth of pending I-526 petitions have slowed (only 1% in-crease compared to Q1) in FY2015 Q2. Figure 4 illustrates this trend quite well.
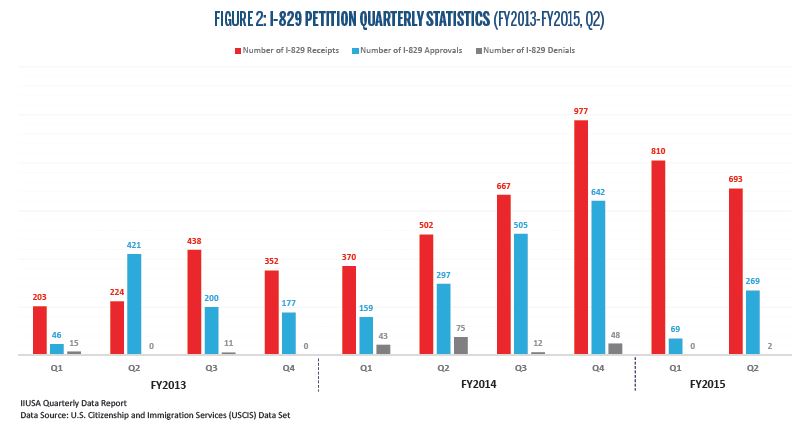
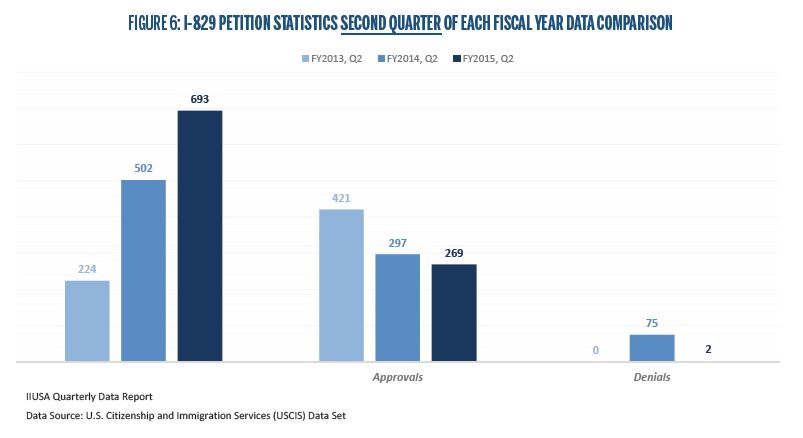
- The number of I-829 receipts in FY2015 Q2 was 693, decreasing by 14% compared to Q1; in year over year comparison, however, it increased by 38% (Figure 5).
- There were 269 I-829 petitions approved in FY2015 Q2, over 280% growth from the last quarter. However, among the past three years in a year-over-year comparison, this most recent quarter saw the least number of I-829 approvals (Figure 6).
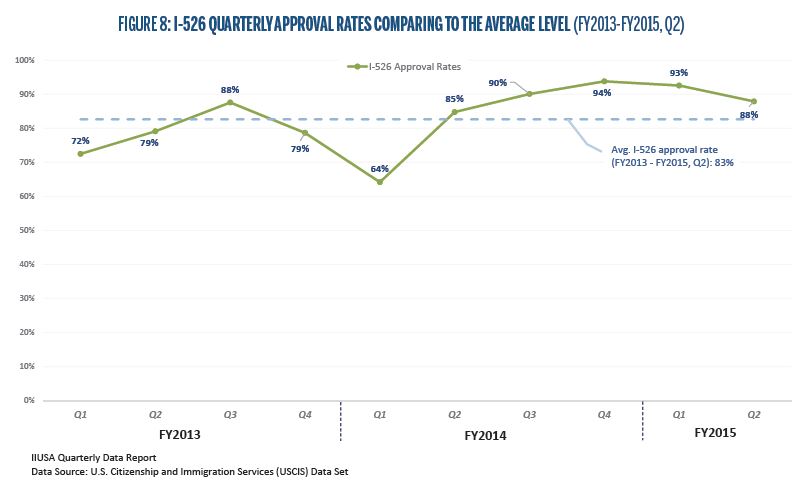
- The approval rate of I-526 petition dropped by 5% to 88% in FY2015 Q2, however, it is still higher than the past three years’ average level of 83% (Figure 8).
- The I-829 approval rate remains at a near-perfect 99% in the second quarter of FY2015 (Figure 9). It presents strong evidence that the Program is delivering its promise not only to the U.S. communities, but to the EB-5 investors as well.
- Since the beginning of FY2015, the processing time for I-526 petition has been hovering around 14 months (Figure 10).
- As of March 31, 2015 (the most recent data by the date of this article), it is expected to take up to 12.7 months to adjudicate an I-829 petition, which is an increase of nearly 50% from the beginning of FY2015 (Figure 10).
- The I-924 processing time has jumped from 6.8 months (as of 9/30/2014) to 12.1 months as of 03/31/2015, an increase of over 77% (Figure 10). The following charts illuminate the EB-5 adjudication trends using the latest I-526/829 and processing time data from USCIS. The completed data reports for I-526/829 are available to IIUSA members online via the new IIUSA member portal.