 $826 Million Foreign in Foreign Direct Investment – Another Record Breaking Quarter for the EB-5 Program Contributions to the U.S. Economy (Volume 3, Issue 1, March 2015, Pages 27-30)
By Lee Li, IIUSA Policy Analyst
After experiencing unprecedented growth in fiscal year (FY) 2014, how will the EB-5 Program (“the Program”) perform in the new fiscal year? The latest data published by U.S. Citizenship and Immigration Services (USCIS) have provided us a clear answer: the EB-5 Program is continuously growing and has contributed more than $820 million in pure foreign direct investment (FDI) to the U.S. economy within just one quarter. This is more than $9 million in capital investments injected into various projects that promote regional economic development every single day.
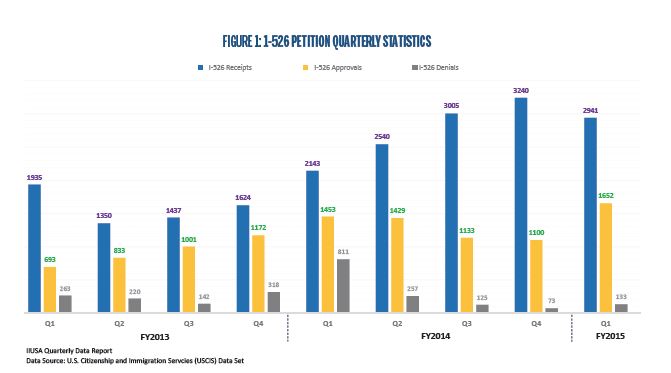
According to USCIS, more than 2,900 I-526 petitions were received during the first quarter (Q1) of FY2015, 1,652 I-526 petitions were approved, and more than 13,000 I-526 petitions are still pending in USCIS’ Immigrant Investor Program Office (IPO). Compared to Q4 in FY2014, the number of I-526 recipients decreased by 9%, while the number of I-526 approvals increased by 50%. Unfortunately, the number of I-526 pending grew by 9% from the last quarter.
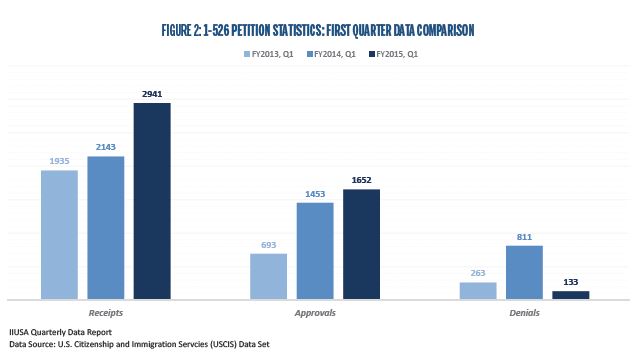
To illustrate the demand trends for the Program in a different perspective, Figure 2 compares the I-526 statistics in the first quarter of FY2013, FY2014, and FY2015. It shows the first quarter in FY2015 had the highest amount of both I-526 recipients and I-526 approvals with the least number of I-526 denials among the first quarters in the past three fiscal years.
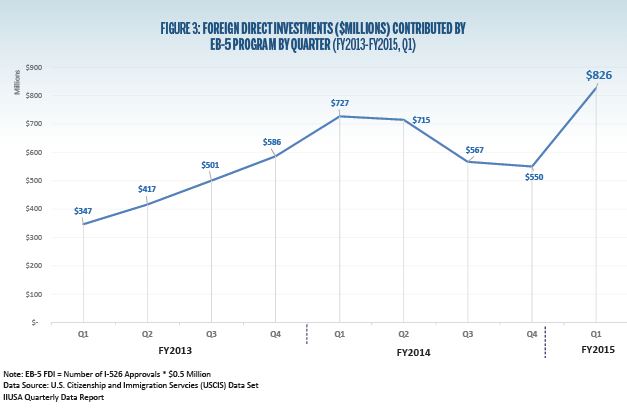
Moreover, the I-526 data demonstrates another trend that the Program is fulfilling its commitment to promote economic growth in U.S. communities. Figure 3 shows that $826 million in FDI was generated by the Program in the first quarter of FY2015, which was a significant increase by $326 million from last quarter in FY2014. In addition, it is the great-est amount of capital that the Program has brought to U.S. economy within one single quarter since the Program started in 1990.
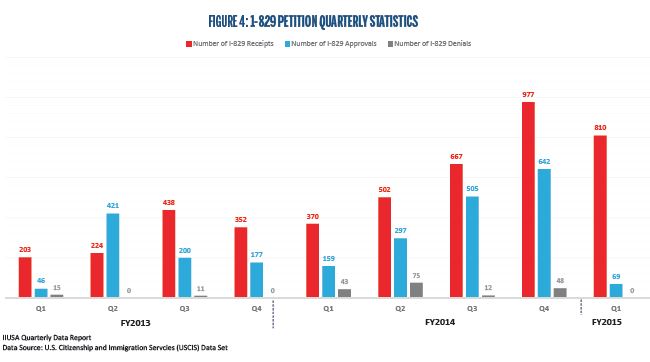
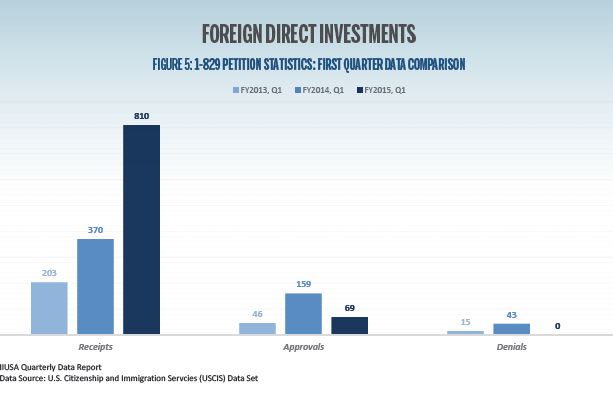
Additionally, based on USCIS’ latest I-829 petitions data set, the number of I-829 recipients was 810 in the first quarter of FY2015, which decreased by 17% from the fourth quarter in FY2014. The number of I-829 approvals dropped by 89% from last quarter to just 69 in Q1, 2015. In contrast, there are more than 3,000 I-829 petitions pending in USCIS, which increased by nearly 50% from Q4, FY2014. One additional data point that is worth mentioning is that not a single I-829 petition was reported as denied in Q1, 2015.
In the year-to-year comparison for the first quarter I-829 data from FY2013 to FY2015, Figure 5 indicates a substantial growth of the number of I-829 receipts, which indicates an increasing amount of EB-5 projects have not only successfully created sufficient American jobs year-to-year but also opened the door for foreign entrepreneurs to reach their dreams of immigrating to the United States.
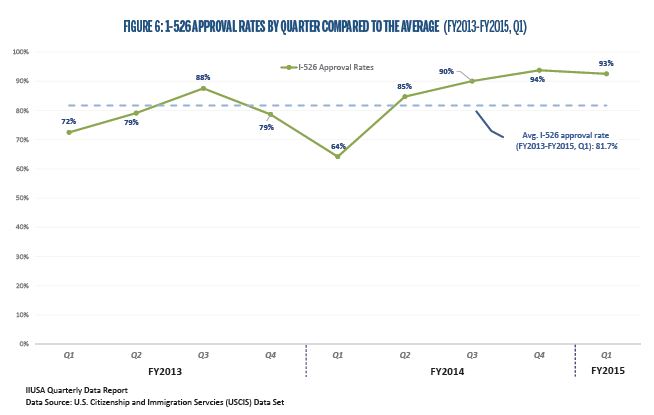
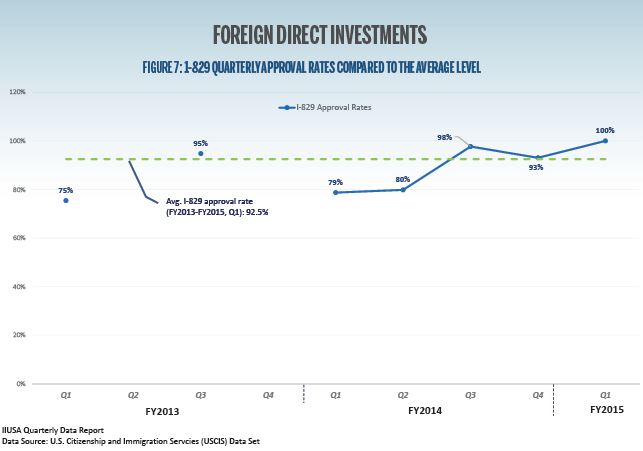
In addition, quarterly approval rates for I-526 and I-829 petitions are also valuable statistics that shed light on the latest trends of EB-5 adjudication. Figure 6 demonstrates the approval rate for I-526 petitions was 93% in Q1, 2015, which was higher than the overall average approval rate for I-526 petitions of 81.7% since FY2013. As for I-829 petitions, the approval rate in the first quarter of FY2015 was 100% due to no I-829 petition being denied from USCIS.
Although USCIS does not release any data sets for I-924 petitions about approved Regional Centers, IIUSA diligently collects this data via the Freedom of Information Act (FOIA) and has been tracking the trends of the EB-5 Regional Center industry. Recently, IIUSA added to its All-Access Pass (AAP) three new comprehensive data reports including the designation data for all approved Regional Centers, market share data in the EB-5 Regional Center industry, and the Final Termination Letters and Notices of Intent to Terminate of all terminated Regional Centers.
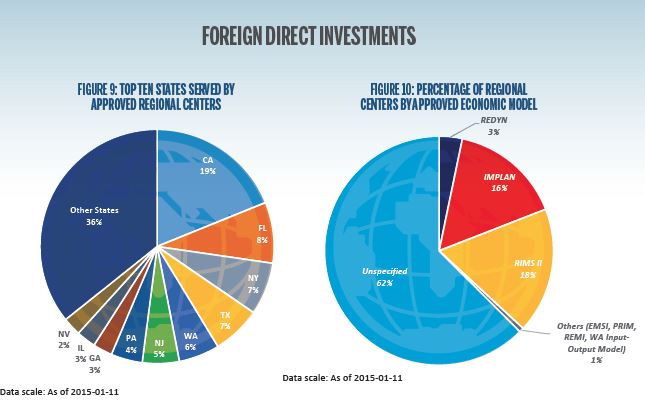
Particularly, the Regional Center Designation Data Report provides valuable data points for EB-5 Regional Center stakeholders. Figure 8 illustrates that the average processing time of a Regional Center application has been decreasing from the peak of nearly 600 days in FY2011 to about 170 days in FY2014. Also, Figure 9 shows state of California ranks first in terms of Regional Center approved geography, to which 19% of all Regional Centers get approved to conduct business, while the second place is Florida. In addition, as Figure 10 in-dicates, 18% of all approved Regional Centers utilize the RIMS II economic model for their business. The complete report along with a substantial amount of well-organized data sets are available through IIUSA’s AAP.
RCBJ Retrospective articles are reprinted from IIUSA’s Regional Center Business Journal trade magazine. Opinions expressed within these articles do not necessarily represent the views of IIUSA and are provided for educational purposes.