By Lee Li, Policy Analyst, IIUSA
Thanks to the Visa Control and Reporting Division at the U.S. Department of State, IIUSA received preliminary results of the latest statistics on EB-5 visa usage in fiscal year (FY) 2017 through July. Although the data is subject to change, the statistics have empowered our analysis to shed some light on the visa capacity issue that is increasingly challenging for the entire EB-5 industry.
EB-5 VISA USAGE OVERVIEW
As of July 2017, more than 8,650 EB-5 visas were used [via Consulate Processing overseas and Adjustment of Status in U.S. Citizenship and Immigration Services (USCIS)] in FY2017. Although the EB-5 Program generates billions of dollars in capital investment and supports hundreds of thousands of U.S. jobs, it only accounts for a small portion of the entire visa issuances every year. According to the Department of State, the annual numerical limits for EB-5 visas in FY2017 is 9,940 , accounting for less than 3% of the annual allocations of all immigrant visa categories. In addition, since FY2008, a total of 66,270 EB-5 visas were used in exchange for more than $20 billion in capital investment that have stimulated a variety of economic development projects across the country and created hundreds of thousands jobs in local communities. Despite the fact that over 33,000 EB-5 visas remained unused in the last decade, the EB-5 Immigrant Investor Program has proven to be an economic development policy that utilizes global connections to generate significant impact on local economies in U.S.
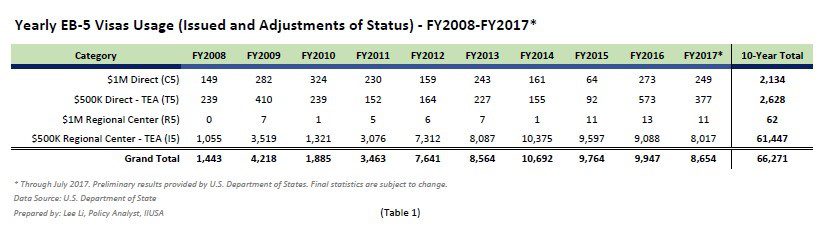
In particular, the EB-5 Regional Center Program (the “Program”) is the major driving force to attract foreign investment since FY2008. As illustrated by Figure 1, in the last five years, over 90% of the EB-5 visas were used by applicants (including principle investors and their eligible family members) who invested in EB-5 Regional Center projects. Moreover, the preliminary statistics shows that approximately 97% of the EB-5 visa were issued to applicants invested in an EB-5 project located in a Targeted Employment Area (“TEA”), among which Regional Center projects in TEAs account for the vast majority of EB-5 visa usage in the last 10 years.
Additionally, our analysis found that 17% of the EB-5 visas were issued via Adjustment of Status (“AOS”) with USCIS, a minor increase from last fiscal year. In fact, on average, only 6% of the Chinese investors obtained their EB-5 visas via AOS, while this percentage among applicants from other countries is much larger (approximately 36%). With the growth of visa usage by investors from the regions other than mainland China in the last three years, we anticipate that the percentage of EB-5 visa issued by AOS could continue to increase.