

IIUSA is excited to announce the launch of our new EB-5 Visa Data Dashboard, providing you with the most comprehensive and up-to-date statistics on EB-5 visa usage. Developed using data sourced from the U.S. Department of State, the EB-5 Visa Data Dashboard offers a wealth of valuable insights. Delve into the historical usage of the EB-5 visa, stay informed with year-to-date visa issuance statistics, and gain insights about the utilization of EB-5 visa by investor market. This cutting-edge resource serves as a vital tool in promoting transparency within the EB-5 Program. It allows users to assess potential visa wait times, while keeping stakeholders informed about the latest trends in EB-5 visa usage.
We are thrilled to make this valuable resource available to everyone, thanks to the support of IIUSA members. If you would like to contribute to the continued success of the EB-5 Program, we invite you to join IIUSA as a member of the national EB-5 industry association today and become part of the EB-5 community.
The EB-5 Visa Data Dashboard offers a range of key features that empower you to gain comprehensive insights and make informed decisions, including:
- Viewing comprehensive data on EB-5 visa usage and trend in one place. The dashboard provides comprehensive statistics on the total number of EB-5 visas utilized, categorized by fiscal year. In addition, the dashboard compares and analyzes the distribution of EB-5 visas issued through consulate processing versus adjustment of status. This breakdown helps you understand the different pathways through which investors obtain their EB-5 visas. Furthermore, we dive deeper into the data by exploring the distribution of EB-5 visas based on investment type. The dashboard offers you insights into the utilization of regional center-based EB-5 projects versus direct EB-5 investments as well as trends in the issuance of visas for projects located in Targeted Employment Areas (TEAs) versus non-TEA projects.
 (Click the image to view animation)
- Comparing annual visa limits and the actual EB-5 visa usage. The dashboard offers a valuable feature that allows you to compare the annual visa numerical limits with the actual number of EB-5 visas utilized. The visualization on the dashboard enables you to easily assess the availability and utilization of EB-5 visas on a fiscal year basis.
 (Click the image to view animation)
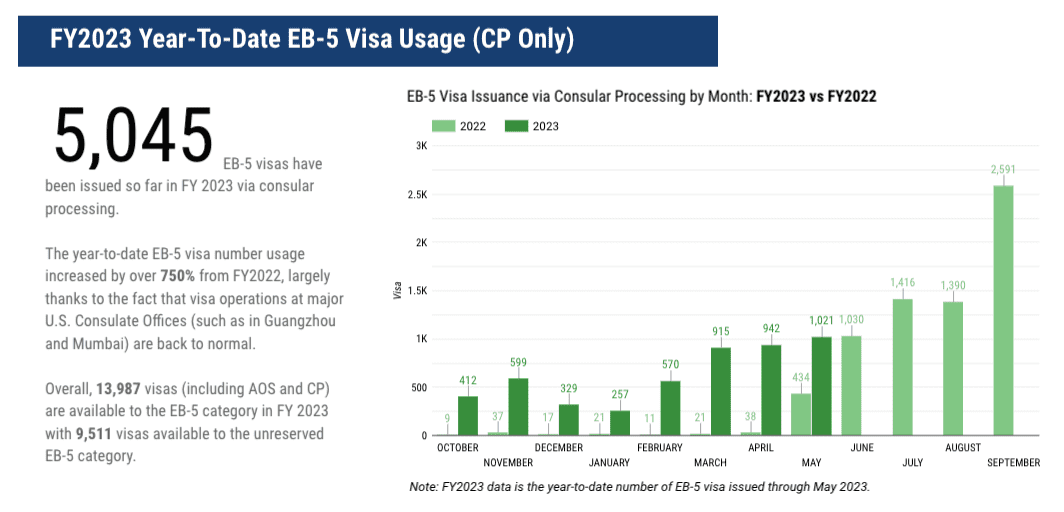
- Staying informed of the latest EB-5 visa usage in the current fiscal year. The dashboard provides real-time tracking of the number of EB-5 visas issued through consulate processing on a monthly basis. This feature ensures that you have access to the latest information regarding the utilization of EB-5 visas in the current fiscal year.
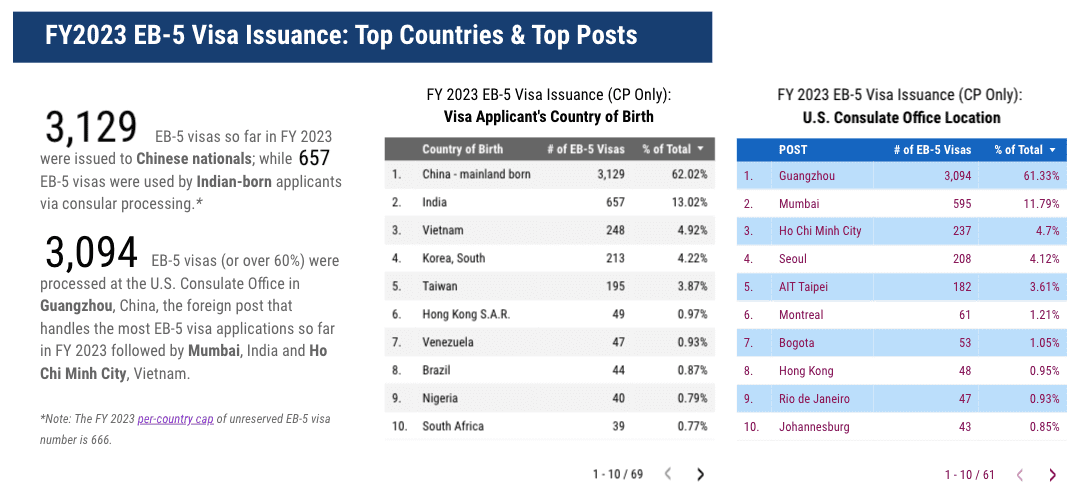
- Predicting movement of EB-5 cut-off dates and optimizing your marketing strategies. The dashboard offers valuable statistics categorized by the applicant’s country of birth and by U.S. Consulate Office. By analyzing the data on EB-5 visa usage by applicant’s country of birth, you can compare the actual number of visas used in the current fiscal year across different countries. This information is crucial for estimating visa availability for the remainder of the year and predicting potential movements in the future Visa Bulletin. Furthermore, the dashboard’s data on visa issuance by Consulate Office location provides insights into the actual geographic distribution of EB-5 visa applicants. This information is invaluable for formulating targeted marketing strategies to raise EB-5 funds and approach potential investors. By understanding the locations where applicants are seeking visas, you can tailor your marketing efforts to specific regions and enhance your outreach to attract potential investors.
- Unlocking comprehensive country-specific data on EB-5 visa usage through the robust data tables featured on the dashboard. With access to EB-5 visa usage data from over 230 investor markets, you can delve into detailed insights regarding the utilization of EB-5 visas for each market. These data tables provide country-specific monthly visa issuance by fiscal year, allowing you to track the trends and patterns of EB-5 visa usage on a month-to-month basis. By examining the data for specific countries, you can gain a deeper understanding of their individual EB-5 visa demand and utilization. In addition, the dashboard offers historical EB-5 visa usage data categorized by adjustment of status versus consulate processing. This breakdown provides valuable context and helps you analyze the distribution of visa utilization methods for each investor market over time.
 (Click the image to view animation)
 (Click the image to view animation)