Earlier this week, IIUSA released a critical update to its mapping tool for high-unemployment areas that qualify as targeted employment areas (TEA) in accordance with the amended definition in the new EB-5 regulations that went into effect on November 21, 2019.
With the most recent data from U.S. Census Bureau’s American Community Survey (ACS), the updated mapping tool:
- visualizes all the areas – including tracts, counties, cities, and metropolitan statistical areas (MSAs) – that could independently quality as a high unemployment area based on ACS 5-Year estimates (2013-2017);
- provides the employment statistics and other data indicators for each census tract, county, MSA, and city or town with a population of 20,000 or more*;
- allows you to search any location in the U.S. and check whether any particular geographical area would independently qualify as a high unemployment area; and
- demonstrates all the tracts that are directly adjacent to your search location, empowering you with the data to calculate the weighted average unemployment rate of an area that consists of multiple census tracts;
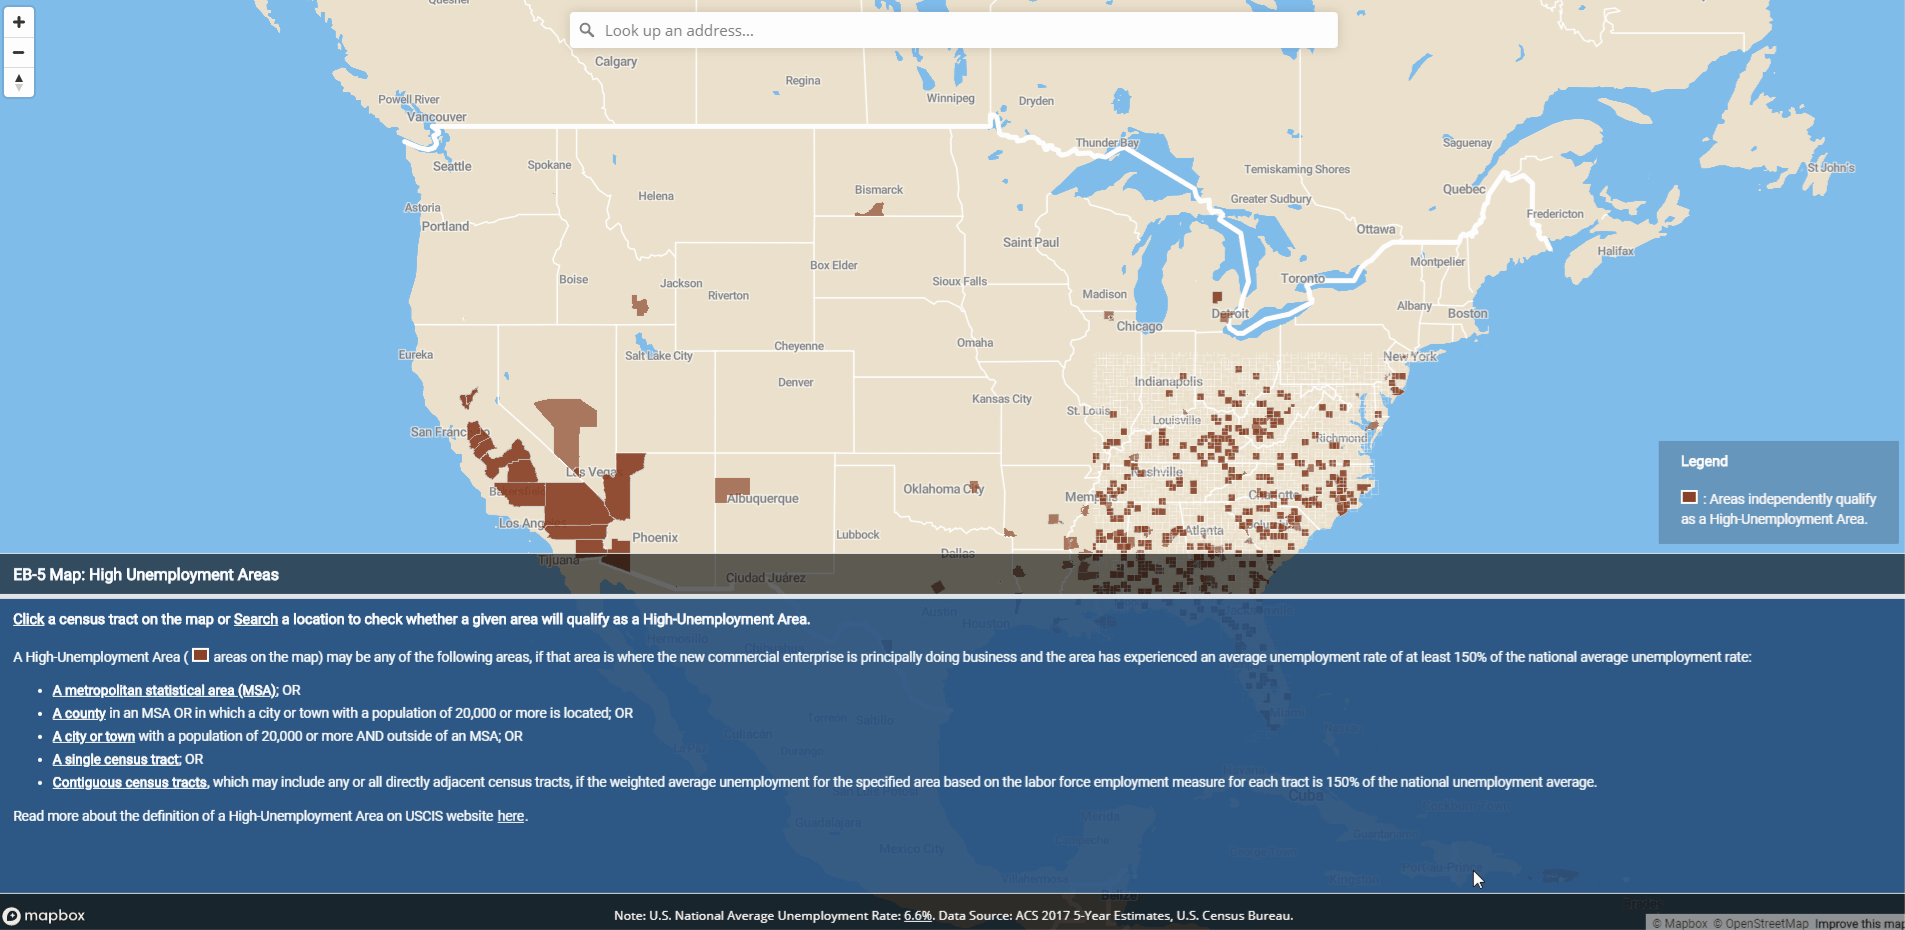
However, it is also important to point out two caveats of this resource:
- Instead of specifying any particular set of data, USCIS allows for the flexibility of using any other “reliable and verifiable” data sets in addition to the ACS data that is utilized on this mapping tool (such as the data from Bureau of Labor Statistics) to evident the area in which the petitioner has invested is a high-unemployment area. That means, the areas that do not qualify under the ACS data set on this mapping tool could still qualify as a TEA using other “reliable and verifiable” data sources;
- Under the new regulations, USCIS allows for a high unemployment area to be an area comprised of the project tract(s) and any or all of the directly adjacent tract(s), if the weighted average of the unemployment rate for all included tracts is at least 150% of the national average. With that, even if one census tract does not independently qualify as a TEA on the map but it “touches” one or more high-unemployment tract(s), it could still meet the new TEA criteria as long as the weighted average unemployment rate of the entire area that consist of both the project tract and the directly adjacent census tract(s) is 150% or higher of the national average. Although the mapping tool does not yet have the feature to allow combining census tracts, it visualizes all of the independent high-unemployment census tract(s) that “touch” any given location and provides the data you need to perform the calculation.
The updated mapping tool is part of IIUSA’s ongoing efforts to inform industry stakeholders of the critical policy changes related to the EB-5 Program. While IIUSA is pleased to provide the TEA mapping tool and help identify potential high-unemployment areas for current or future projects, you should consult with the necessary and qualified EB-5 professionals for an in-depth TEA review and analysis.