
IIUSA recently obtained data on EB-5 adjudications at U.S. Citizenship & Immigration Services (USCIS) for FY2013. In doing so, we have rounded out receipt/approval/denial data for I-526/I-829 petitions and I-924 applications since the start of the EB-5 Program. This comprehensive dataset, which spans from 1991-2013, is available exclusively to IIUSA members and paints a complete picture of adjudication and investor demand trends since the beginning.
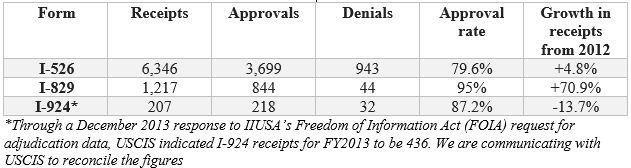
The table below shows I-526/829/924 filing statistics for FY2013:
Click here to view the full dataset from 1991-2013.
The comprehensive dataset brings to light several data points that all EB-5 industry stakeholders should be aware of. Here is a list of our eight favorites (we look forward to hearing what yours are!):
- The 6,346 I-526 petitions received in FY2013 accounts for $3.25+ billion in capital formation – a record setting year – while the 3,677 I-526 approvals account for just over $1.83 billion.
- FY2008-2013 (the most recent six years) accounts for 68.5% of all I-526 receipts and 62.8% of all I-829 receipts.
- The I-526 approval rate over the last six years (FY2008-2013) averages out to 83.7%, much higher than the 64.4% over the entire span of the Program’s existence. We see this as evidence that EB-5 policy has become more predictable in recent history, improving approval rates along the way.
- Over the last three years (FY2011-2013), I-526 approval rates have hovered right around 80%; while the I-829 approval rate has eclipsed 90% in each of those years.
- In FY2013, I-829 filing volume was the second highest it has ever been at 1,217, behind only FY2011 when 2,345 were received by USCIS. Given the higher volume of I-526 filings over time, we expect even higher I-829 volume in FY2014.
- The I-829 approval rate over the last six years (FY2008-2013) averages out to 87.1%, much higher than the 73.2% over the entire span of the Program’s existence. We see this as evidence that the Program is delivering on its promise to EB-5 investors!
- I-924 approvals were up 500+% between FY2012 and FY2013, going from 35 to 220 in just one year! This includes applications for initial designation and amendments to existing designations. USCIS made some policy decisions in 2013, while enhancing its administrative capacity, that made this possible.
- The I-924 approval rate jumped from 35.7% in FY2012 to 87.2% in FY2013.
What do these adjudication trends say about the EB-5 Program’s promise to create American jobs, generate federal/state/local tax revenue and contribute to overall U.S. GDP? To answer this vital question, we must take a closer look at the results of the IIUSA-commissioned Economic Impact assessment of the EB-5 Program from 2010-2011 and early initial results from the 2012 report (which has been drafted and is currently under peer-review, before finalizing and publishing in a matter of weeks). According to our initial results, in 2012 the industry supported 42,000+ American jobs, added $3.39+ billion in GDP and generated $712+ million in federal/state/local tax revenue (up from 33,000+ jobs, $2.6 billion in GDP, and $564+ million over the previous TWO years combined!).
All of this data, in tandem with IIUSA’s EB-5 Economic Impact reports, goes to show that the EB-5 Regional Center Program is close to maxing out its capacity. Without legislative reforms, such as recapturing unused visas since 1990, eliminating per country caps, and only counting the principal visa applicant toward the annual visa allocation (currently, the entire investor’s family is counts against the visa cap) the EB-5 Program is set for a collision course with a nightmare retrogression scenario. IIUSA remains hard at work advocating for these changes in Congress and are hopeful 2014 will provide relief we all hope to see.