
IIUSA is excited to release our latest EB-5 economic impact mapping tool which highlights the total economic contribution of the EB-5 Regional Center Program for FY2010-FY2015. The new tool provides users with a high level overview of EB-5 economic impact as well as an in-depth look at EB-5 contributions at state and even congressional district levels!
The tool is just one of IIUSA’s growing resources that ensure our members, industry stakeholders and the public alike are informed and empowered with the necessary information they need to continue drive industry development and to advocate for the Regional Center Program.
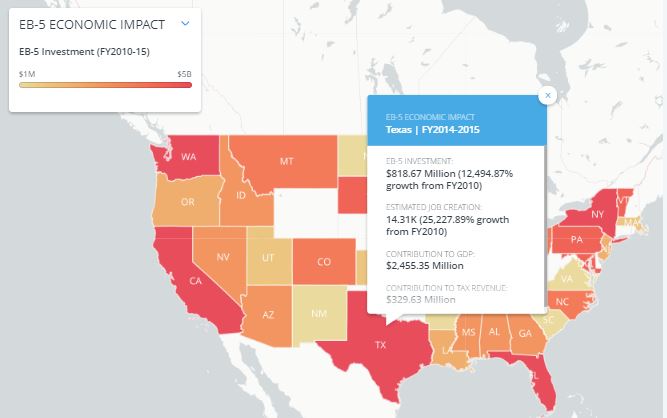
Key Features Include:
- Economic impact analysis by state and congressional district;
- EB-5 Regional Center economic impact data dashboard;
- Downloadable EB-5 economic impact datasets;
- Filter states by the total amount of EB-5 capital investment; and
- Growth trend analysis of EB-5 investment & job creation by state.
As you explore the map we encourage you to submit any questions or comments you may have to research@iiusa.org. We hope you find the tool to be a valuable addition to your EB-5 toolbox.
Explore the Map
Download the Datasets
We welcome all IIUSA members to download the data sets on EB-5 economic impact by state & congressional district by following the links below with just one click (Economic impact by state | economic impact by congressional district). Not yet a member? Complete this short form the receive access.