
 Currency Exchange Fluctuation and “Return on Investment” in the EB-5 Investor Visa Program
by Vivek Tandon Esq, Founder and CEO, EB5 BRICS
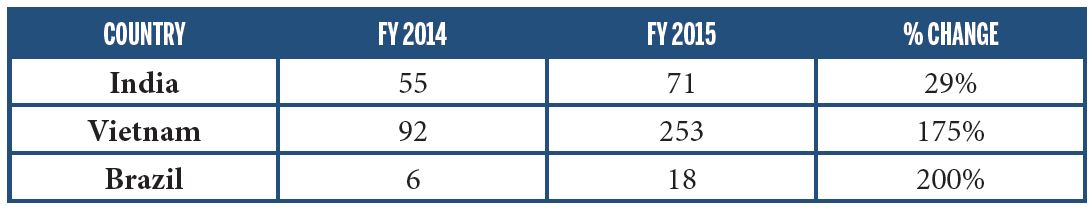
It is certainly no secret that China is by far the leading source of EB-5 applicants, and thus, insights about the Chinese market are covered extensively by EB-5 industry experts. However, recent retrogression issues with China is forcing more and more industry stakeholders to look at the so- called ‘emerging’ EB-5 markets such as India, Vietnam, and Brazil. There is growing demand for the EB-5 visa category from these countries as evidenced in the table below from U.S. State Department for Fiscal Years 2014 and 2015, which shows the increase in EB-5 visa applicants from the aforementioned countries, and judging from the escalation of EB-5 promotion activities in these countries.
One of the focal points of any conversation with investors from India, Brazil and Vietnam (aside from the primary objective of obtaining permanent U.S. residency) is the apparent low rate of return in EB-5 investments. It seems that EB-5 investments in the U.S. generally net 0.5-1.5% per year, compared to the 7-8% per year or more investors can earn in their home countries from fixed deposit accounts. However, in order to more accurately reflect return on investment in the EB-5 applicant’s home country one must address, compare and adjust for currency exchange rate fluctuation in the respective countries.
The tables below show currency exchange rates over the last five years for the Indian Rupee, Vietnamese Dong and Brazilian Real as compared to the U.S. Dollar (“USD”) which naturally affects the value of the currency at a global level. Again, this is historical data and there is the possibility that such downward currency devaluation trend may not happen again in the coming years. One should also recognize that some or all of this loss in value of the home country’s currency when compared to the USD could have been hedged with forex futures and/or forwards.
CURRENCY EXCHANGE FLUCTUATIONS per 1 USD for the period 2010 to 2015
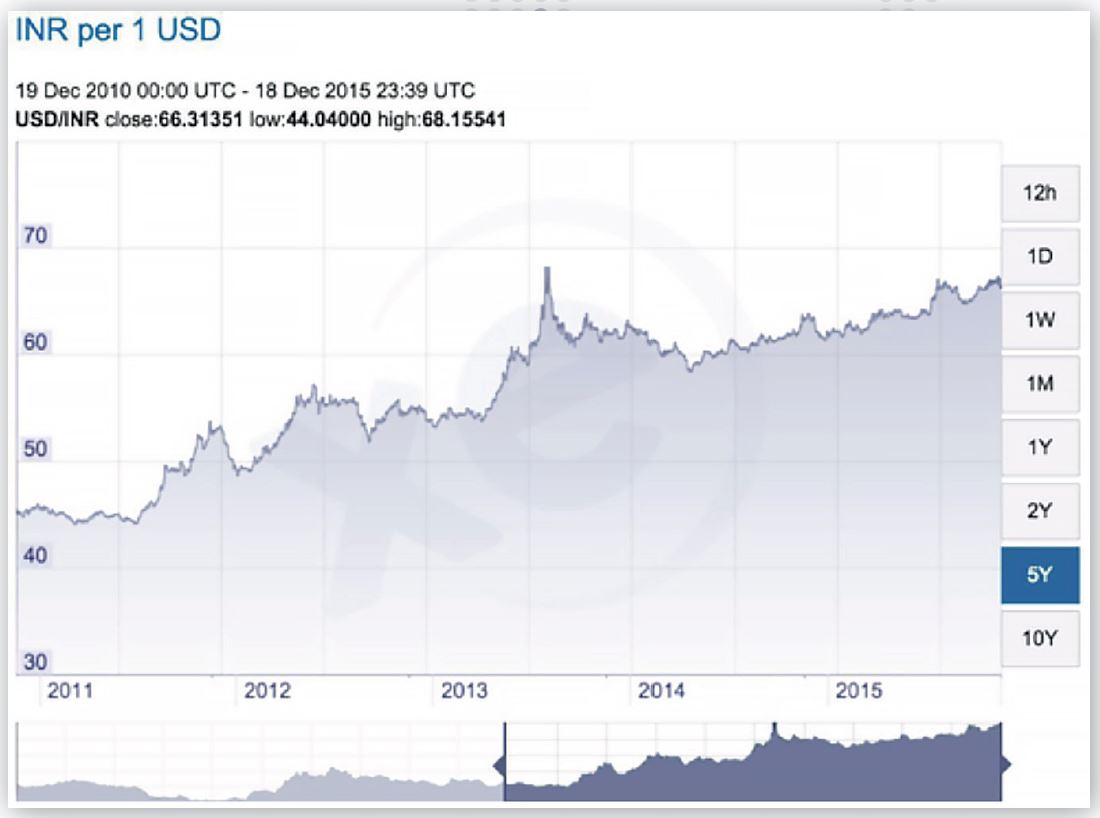
The table on the above shows that the Indian Rupee has devalued from INR 44 to more than INR 66 as compared to the USD, losing more than 50% of its value over the last five years.

The table below shows that the Brazilian Real has devalued from BRL 1.7 to almost BRL 3.9 as compared to the USD, losing almost 129% of its value over the last five years.

The table on the left shows that the Brazilian Real has devalued from BRL 1.7 to almost BRL 3.9 as compared to the USD, losing almost 129% of its value over the last five years.
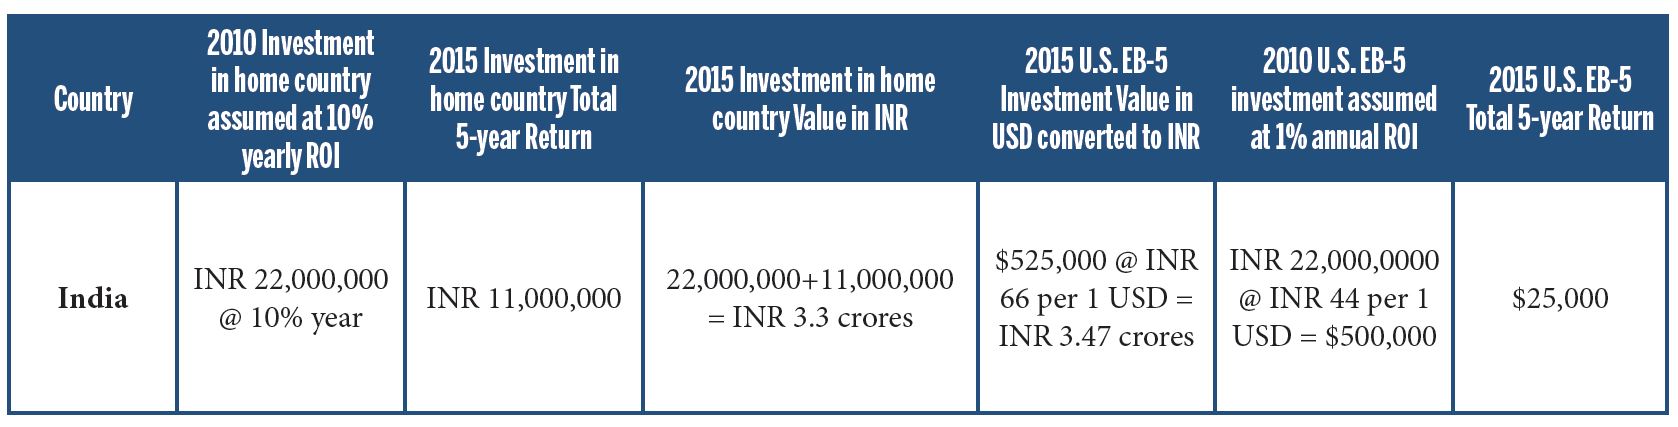
In each of the three scenarios that follow, the general assumption is that the investor is in one country investing in another and once the investment is over the investor converts currency back to the “home” country where the investor presumably repatriates the money. Using the example of an EB-5 investor from India, the comparison then is to assume the investor is in India investing in India or investing in the US, but after the investment the investor converts the dollars back to rupees and compares the resulting value in rupees.
And thus, as shown below, if an Indian investor was to invest INR 2.2 crores (equivalent to $500,000 at an exchange rate of INR 44 to 1 USD) in 2010 in an EB-5 investment in the US for a 5-year term at a very nominal 1% yearly rate of return (simple interest), the resulting value of that investment in Year 2015 would be $525,000, which when converted back to rupees at INR 66 to 1 USD translates to approximately INR 3.47 crores. In comparison, again assuming ‘simple interest’ (not ‘compound’ which might be the case in the home country) if the same INR 2.2 crores had been invested in India for the time period 2010-2015 at an average of 10% annual return on investment (Deposit Interest Rates in India have been in the 9-10% range from 2010 to 2015 http://capitalmind.in/2012/01/chart-of-the-day-bank-fd-rates-from-1976/), the resulting value of principal and interest in year 2015 would be INR 3.30 crores. Comparison of this to the INR 3.47 crores figure derived from the U.S. investment shows that the investor’s belief and perception of a higher ‘return’ by keeping capital invested in the home country may just be a fallacy.
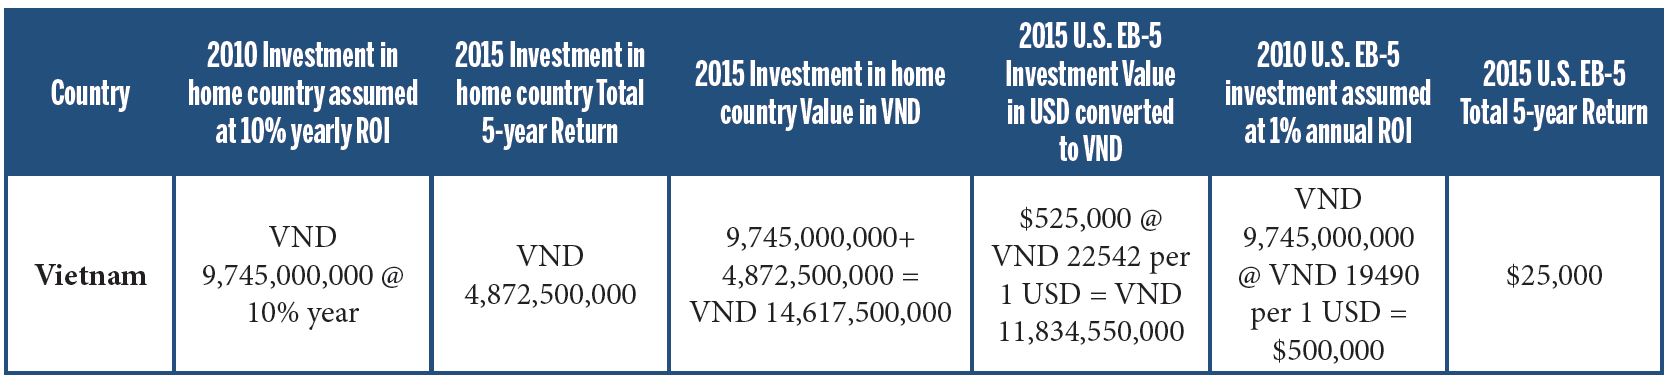
Similarly, if a Vietnamese investor was to invest VND 9,745,000,000 (equivalent to $500,000 at an exchange rate of VND 19490 to 1 USD) in 2010 in an EB-5 investment in the US for a 5-year term at a very nominal 1% yearly rate of return (simple interest), the resulting value of that investment in Year 2015 would be $525,000 which when converted back to Vietnamese Dong at VND 22542 to 1 USD translates to approx. VND 11,834,550,000. In comparison, again assuming ‘simple interest’ if the same VND 9,745,000,000 had been invested in a fixed deposit in Vietnam for the time period 2010-2015 at an average of 10% annual return on investment (Deposit Interest Rates in Vietnam have ranged from 13.99 in 2010 to 7.80 in 2015 http://data.worldbank.org/indicator/FR.INR.DPST), the resulting value of principal and interest in year 2015 would be VND 14,617,500,000 for a gain of VND 2,782,950,000 or approx. $123,500. As such, an investor from Vietnam would have fared a bit better financially by holding that money in a Fixed Deposit Account in Vietnam for the 5-year period instead of the U.S. EB-5 Program.
On the other hand, if a Brazilian investor was to invest BRL 850,000 (equivalent to $500,000 at an exchange rate of BRL 1.7 to 1 USD) in 2010 in an EB-5 investment in the US for a 5-year term at a very nominal 1% yearly rate of return (simple interest), the resulting value of that investment in Year 2015 would be $525,000 which when converted back to the Brazilian Real at BRL 3.9 to 1 USD translates to approx. BRL 2,047,500. In comparison, again assuming ‘simple interest’ and ‘simple adjustments’ (not ‘compound’ which might be the case in the home country) if the same BRL 850,000 had been invested in Brazil for the time period 2010-2015 at an average of 10% annual return on investment (Deposit Interest Rates in Brazil have ranged from 11% in 2010 to 10% in 2015 http://data.worldbank.org/indicator/FR.INR.DPST), the resulting value of principal and interest in year 2015 would be BRL 1,275,000. As such, an investor from Brazil would have fared much better financially by investing in the U.S. EB-5 Program instead of holding that money in a Fixed Deposit Account in Brazil for the 5-year period.

Again, the analysis of the three different scenarios above is an ex-post analysis showing what could have happened over this particular 5-year period when subjected to currency rate fluctuations, which may never happen again or that could be reversed in the next 5 years. Clearly the 50% devaluation in India’s currency and the 129% devaluation in Brazil’s currency are very substantial factors that should have informed the investor’s financial analysis of whether to invest in the EB-5 program.
Many other factors are relevant to “return on investment” considerations that are focused on comparing investment in the home country vs. investment in the EB-5 program. For instance,, an investor should factor in an estimated $75,000 in costs and fees associated with a regional center EB-5. However, in some cases that amount may be offset by a possible higher than 1% annual rate of return from the EB-5 investment. Also taken into account should be the tax consequences of the interest payments whether it be in the home country or the United States. Finally, while an actual monetary return can be a consideration when an investor is making an EB-5 investment decision, an investor should not lose sight of the real return on an EB-5 investment which is the ability for the investor and/or his or her family to live and work anywhere in the U.S. and possibly lowered costs for higher education, the benefits of which can pay for themselves many times over.
https://www.eb5brics.com/eb-5-investor-visa-for-india/