 EB-5 Data of the Year Presents an Unprecedented Growth of the EB-5 Regional Center Prgoram in FY2014 (Vol. 2, Issue 4, December 2014, Pgs. 40-46)
by Lee Li, IIUSA Policy Analyst
Fiscal year (FY) 2014 was definitely another record breaking year for the EB-5 Regional Center Program (the “Program”) – data does not lie. The comprehensive data set of I-526/I-829 petitions, I-924 applications, and EB-5 visa usage statistics of FY2014 illustrates an undeniable fact that the Program is delivering its promises of generating a significant amount of foreign direct investment (FDI) and enhancing economic development in U.S communities as well as creating substantial numbers of American jobs- all at no cost to the taxpayers.
Statistics on I-526 petitions are good indicators of the demand for the Program and they also correspond to the amount of FDI that the Program contributes to the U.S. economy. As Figure 1-A shows, the United States Citizenship & Immigration Services (USCIS) received 10,928 I-526 petitions in FY2014, which increased by 72.2% from FY2013. In addition, it represents more than $5.5 billion in potential FDI brought by the Program to stimulate economic development in just one single fiscal year. Moreover, 5,115 I-526 petitions were approved in FY2014, which indicates more than $2.56 billion FDI has already been injected into projects across different industries to create American jobs and promote regional economic development. Additionally, Figure 2-A indicates the amount of FDI generated by the Program in FY2014 is a 4-fold increase from FY2009! This not only demonstrates the Program is experiencing unprecedented growth during the past five fiscal years, but also job creation and economic stimulation.
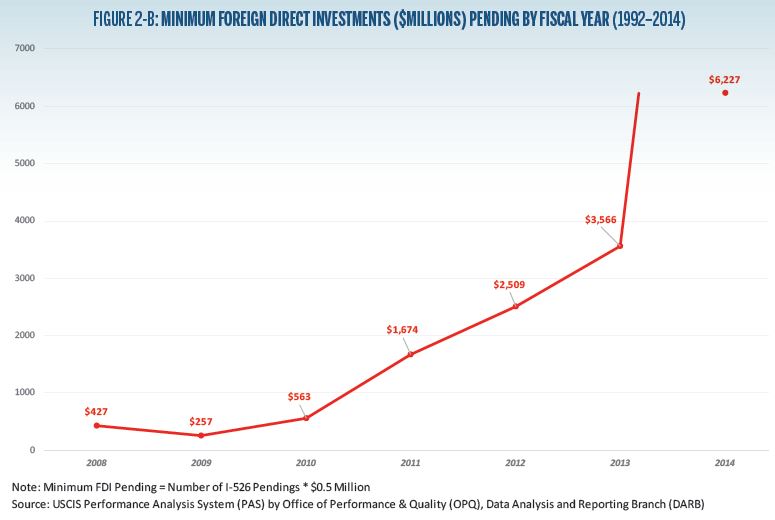
However, as Figure 1-B shows, 12,453 I-526 petitions are still pending in the end of FY2014, which has increased by 74.6% from 7,131 in FY2013. These petitions awaiting adjudication represent $6.2 billion in capital investment (see Figure 2-B) that could be used to create more than 24,000 American jobs. From FY2013 to FY2014, the growth rate of I-526 pending (74.6%) is still higher than the growth rate of I-526 receipts (72.2%), which indicates that investor demand for the Program is so strong that USCIS needs to optimize the adjudication process in order to fully unleash the potential power of the Program in a timely manner to maximize its economic impact to the country.
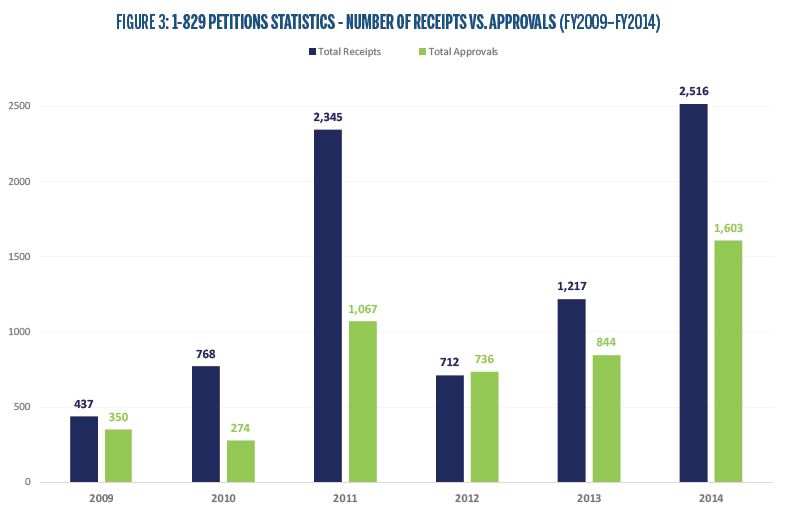
Furthermore, I-829 data illustrates the substantial success of the Program in FY2014 that benefits the entire country. As Figure 3 shows, 1,603 I-829 petitions were approved by USCIS in FY2014, which is not only a 90% in-crease from FY2013, but also a record breaking number since the beginning of the Pro-gram in 1992. It represents tens of thousands of jobs successfully created by the Program and more than a thousand foreign entrepreneurs living out their immigration dreams to become proud contributors to U.S. communities.
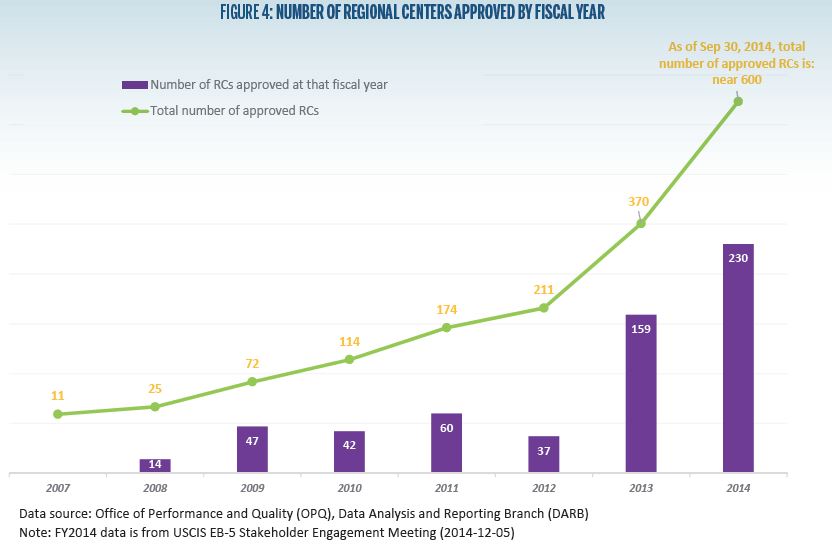
Both the Program and the industry experience significant growth in FY2014. Based on the briefing provided by USCIS Investor Program Office Chief Nicholas Colucci at the last EB-5 stakeholder engagement meeting in Washington D.C. this December 2014, the number of approved Regional Centers increased by 230 from FY2013 to near 600 at the end of FY2014 (see Figure 4)- a 62% growth rate from FY2013. However, 28 Regional Centers were sent Notices of Intent to Terminate (NOITs) since they “no longer served to promote economic growth” and seven Regional Centers were terminated in FY2014 due to failure to file Form I-924A, according to Mr. Colucci.
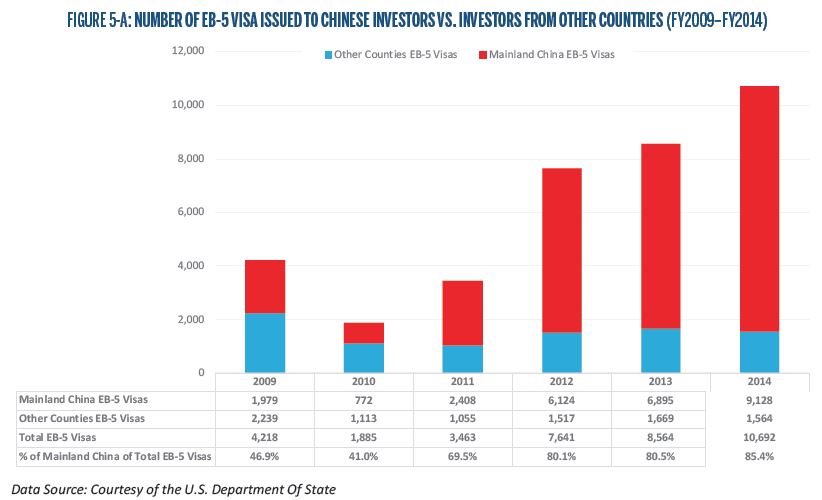
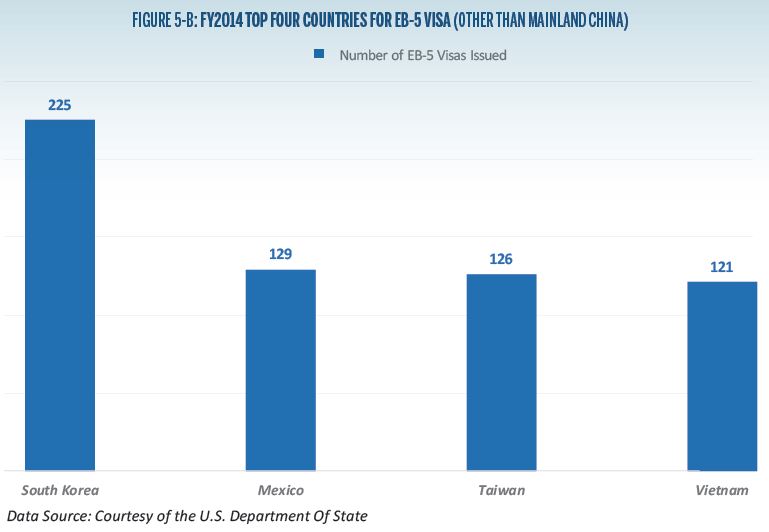
The EB-5 visa usage statistics demonstrate the substantial growth of the Program from a different angle. In FY2014, it was the first time the Program reached its 10,000 annual visa quota. According to the U.S Department of State, 10,692 EB-5 visas were issued in FY2014 with a growth rate of 24.8% from FY2013. As Figure 5-A shows, 9,128 EB-5 visas were issued to Mainland China investors and their family members, which accounts for 85% of total EB-5 visa usage in FY2014. The EB-5 visa unavailability in FY2014 indicates the current 10,000 EB-5 visa quota is no longer meeting the drastic demand and growth of the Program. A new visa allocation policy as well as the permanent reauthorization of the Program are needed to fulfill the Program’s capability of enhancing economic development and creating jobs for Americans. In addition, Figure 5-B presents the other top four investor markets using the highest amount of EB-5 visas in FY2014, which are South Korea, Mexico, Taiwan, and Vietnam.
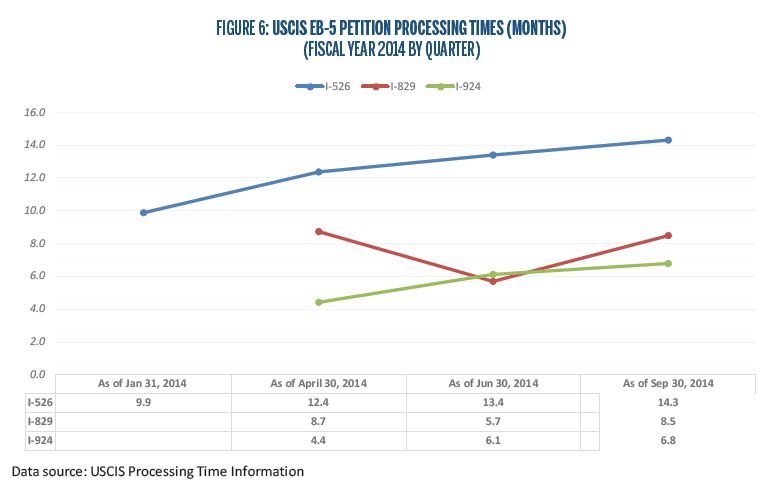
On the other hand, EB-5 processing time and I-526/I-829 approval rate statistics shed some light on the adjudication trends of the Program in FY2014.
Figures 6 represents the trends of EB-5 processing time by quarter in FY2014. For I-526 petitions, the processing time continued to increase from the first quarter from 9.9 months to 14.3 months in the end of FY2014. Also, as of September 30, 2014, the processing time to adjudicate I-924 petitions for a potential regional center was 6.8 months, while it took 8.5 months to process the I-829 petition to remove conditions for an EB-5 investor.
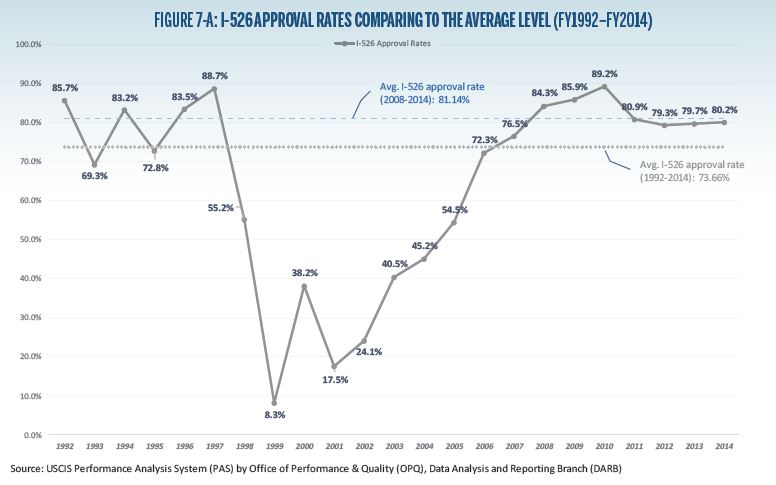
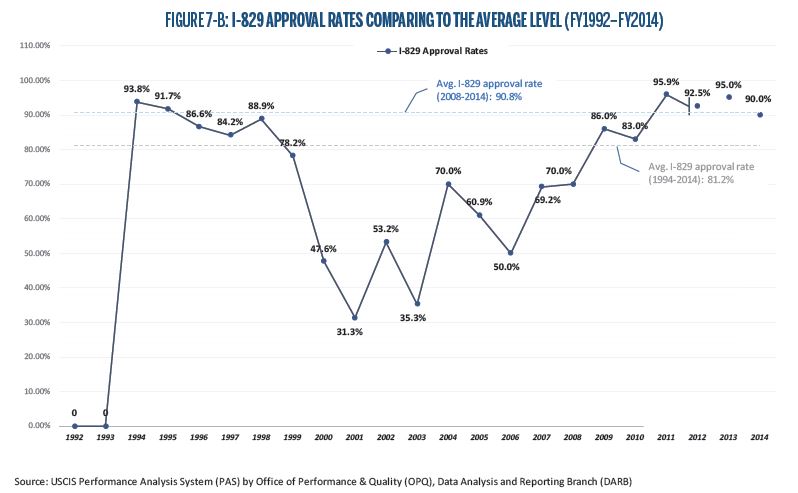
The I-526 approval rate slightly increased to 80.2% in FY2014 from 79.7% in FY2013. As Figure 7-A indicates, it is higher than the overall average approval rate of 73.66% since the beginning of the Program in 1992 and is approaching the average level of 81.14% during the post-recession time period (FY2008-FY2014). For I-829 petitions, the approval rate in FY2014 was 90% (see Figure 7-B), which has, however, decreased by 5% from the approval rate of 95% in FY2013. But it is still considerably higher than the overall average approval rate of 81.2% from FY1992 to FY2014 and very close to the average level of 90.8% of the post-recession time period.
Looking back on FY2014, I-526 statistics show a significant increase of investor demand for the Program as well as the billions of dollars of capital investments the Program is generating for the U.S. economy. I-829 data demonstrates that as conditions are removed and investors earn their permanent green cards, at the same time tens of thousands of U.S. jobs are being created across the country. The substantial increase of I-924 approvals represents the fast growing EB-5 Regional Center industry that is contributing to regional economic development in U.S. communities. All data together is speaking with a loud and clear voice: “EB-5 is Working. For You. For America.” ■
(Click Charts Below to View in Browser)


RCBJ Retrospective articles are reprinted from IIUSA’s Regional Center Business Journal trade magazine. Opinions expressed within these articles do not necessarily represent the views of IIUSA and are provided for educational purposes.